Figures & data
Table 1. Chronological Overview of Economist Petitions
Table 2. Social Network Measures and their Interpretation for Economist Petition Networks
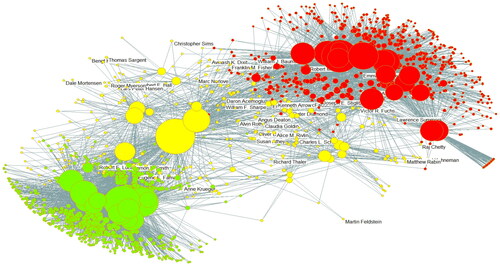
Figure 1. Social Structure of Petitions and Petition-Signing Economists in Nall
Note: Circles represent economist petitions and signatories. The size of the circles indicates the overall degree of the node (i.e., the number of signatures of a petition or by an economist, respectively). Economists with only one signature are excluded from the figure. Network graphs in this article are created with the commonly used algorithm “Fruchterman-Reingold” in Pajek. Applying other algorithms (e.g., “Kamada-Kawai”) yields similar results.
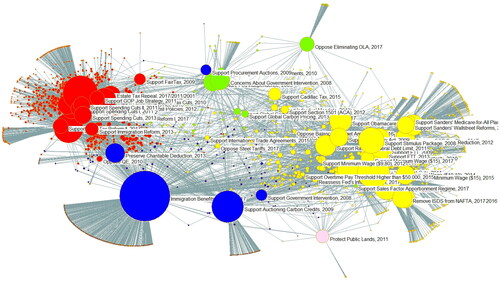
Figure 2. Social Structure of Petitions and Petition-Signing Economists in Npoleng
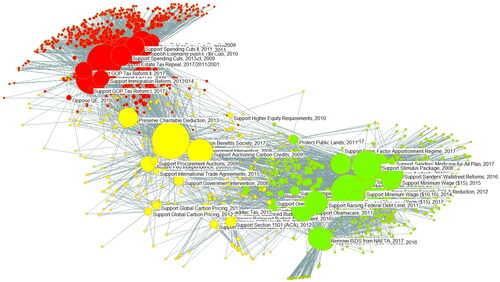
Table 3. Community Structures in Npoleng
Figure 3. Social Structure of Fiscal Policy Petitions and economists Signing Fiscal Policy Petitions (Nfiscpol)
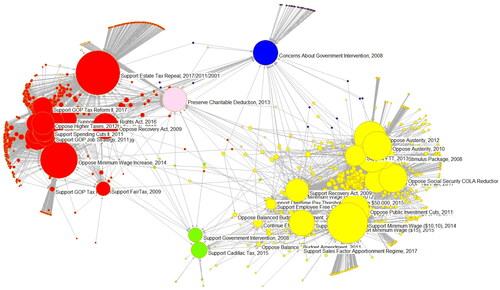
Table 4. Community Structures in Nfiscpol
Figure 4. Social Structure of “Public Economists” (Npubecon)
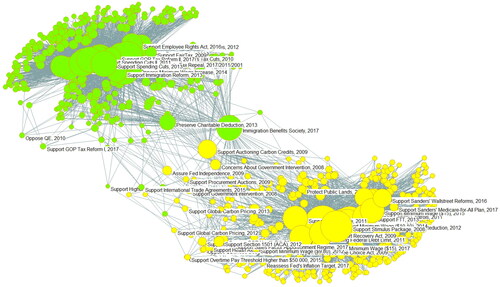
Table 5. Community Structures in Npubecon
Figure 5. Community Structures of Economists with High Academic Prestige (Nelite)