
Figures & data
Table 1. Number and percentage of participants in each condition who changed their misconception to true belief from t1 to t2.
Table 2. Final logistic regression models of belief change and misconceptions in written justifications.
Figure 1. Confidence accuracy before and after reading by condition. Note. Mean confidence accuracy scores before and after reading the text are shown for different text types and reading goals. Small confidence accuracy values indicate inappropriate confidence in a misconception, and high values indicate appropriate confidence in a correct belief. Error bars show 95% confidence intervals.
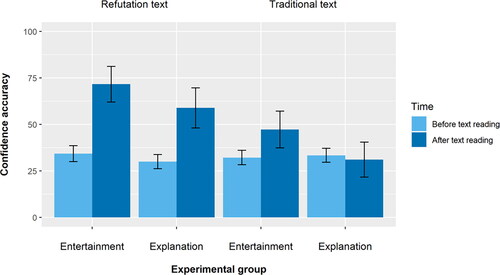
Table 3. Three-way ANOVA statistics for confidence accuracy.
Figure 2. Relative frequency of misconceptions and correct answers in participants’ written justifications.
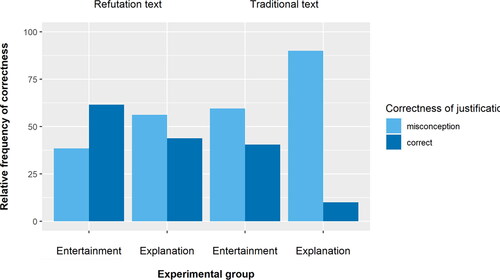
Table 4. Exemplary quotations from participants’ justifications.
Supplemental Material
Download PDF (197.8 KB)Supplemental Material
Download PDF (549.5 KB)Supplemental Material
Download PDF (198.6 KB)Data availability statement
This study was registered with the OSF. The data that support the findings of this study are openly available at the OSF.