
Figures & data
Figure 1. A: Location of the Taupo Volcanic Zone, coincident Taupo Rift and the volcanic centres (triangles) in the North Island of New Zealand. Box shows the area of panel B and maps in . B: Hillshade map of Tongariro and Ruapehu stratovolcanoes, showing key locations (dots and arrows), faults (annotated lines) and eruptive vents (triangles) described in this paper.
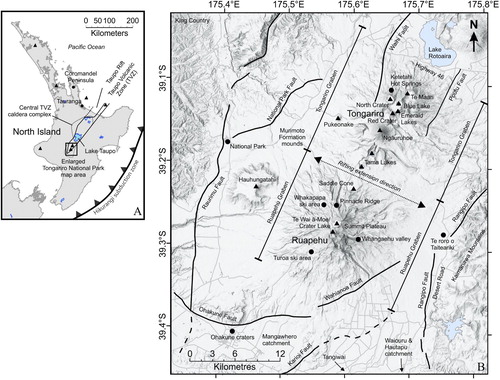
Figure 2. Oblique aerial view of the Tongariro National Park area with Ruapehu and Tongariro stratovolcanoes, including the prominent Ngāuruhoe cone (Tongariro), looking south. The Waihi Fault splays are picked out by shadow on the right (west) side of Tongariro (white arrows). Ketetahi hot springs are labelled ‘k’. Lake Rotoaira in the left foreground. GNS Science photo by Dougal Townsend.
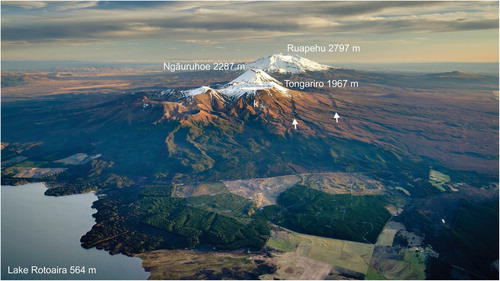
Figure 3. A: Simplified geological map of the Tongariro and Ruapehu edifices and ring plains, Cross sections in run along the line S-N; B: Glacial ice extent and moraines at the stratovolcanoes through time. Maps modified from Townsend et al. (Citation2017). Key major faults are labelled on .
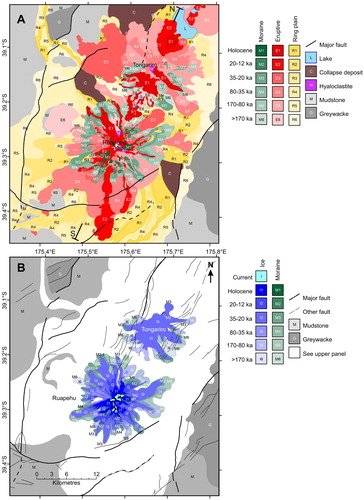
Figure 4. Summary geophysical data and models for the TNP stratovolcanoes. A: Reduced to pole, total magnetic intensity anomaly for Tongariro; modified from Miller and Williams-Jones (Citation2016). B: a model of the extent of the hydrothermal system as revealed by magnetic and gravity data, looking south-southwest; red is low density hydrothermal alteration, blue is low magnetisation hydrothermal alteration, the grey lower surface represents the greywacke basement derived from gravity data; modified from Miller and Williams-Jones (Citation2016). C: Depth to the basement (red contours in hundreds of metres) as determined by gravity data. Basement depth shown as contour lines overlain on simplified geological map. Reproduced with permission from Robertson and Davey (Citation2018). D and E: 3D model and cross section showing magnetic susceptibility distribution at Ruapehu. High magnetic susceptibility bodies are inferred as lava and intrusions, while low magnetic susceptibilities indicate alteration. ‘D’ model modified from Miller et al. (Citation2020), ‘E’ Modified from Kereszturi et al. (Citation2020).
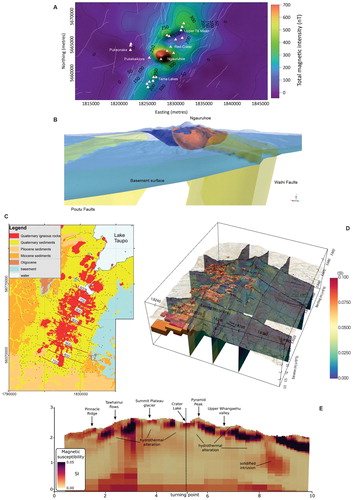
Figure 5. Deep (A) and shallow (B) schematic NNE-SSW cross sections summarising the subsurface structure and features as inferred from geophysical data (based largely on: Cassidy et al. Citation2009; Godfrey et al. Citation2017; Hill et al. Citation2015; Ingham et al. Citation2009; Jones et al. Citation2008; Kereszturi et al. Citation2020; Kilgour et al. Citation2013; Miller and Williams-Jones Citation2016; Miller et al. Citation2020; Rowlands et al. Citation2005). Geophysical information in bold text and geological interpretation in plain text. Line of sections shown in .
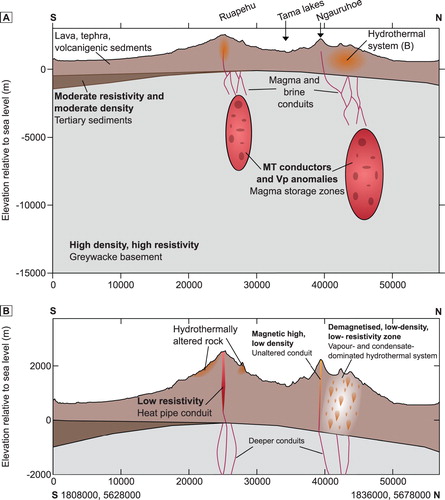
Figure 6. View looking southwest across Tongariro showing the relationship of ice-bounded lavas and breccia confined to high topography, and younger draping lavas and pyroclastic deposits that descend into the valley floors. Note also the symmetrical Ngāuruhoe cone, emplaced in a relatively ice-free environment. See for key to rocks labelled in the lower panel. Modified from Pure et al. (Citation2020).
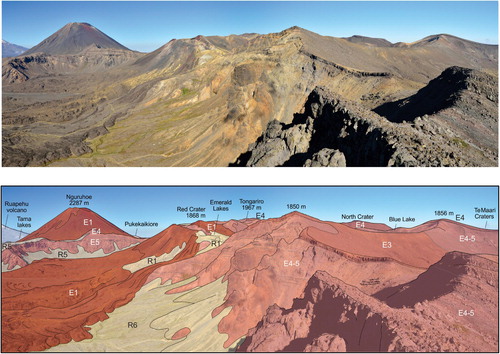
Figure 7. Volcanic formations of Ruapehu and Tongariro illustrated in time and in space from southwest to northeast. Black boxes enclose labelled primary volcanic formations (F). Grey boxes represent constituent members of those formations (see Townsend et al. Citation2017 and Pure et al. Citation2020 for details of those members). Airfall tephra formations named in text in italics. Volcaniclastic formations named in text underlined. Major events in the formation of these volcanoes are annotated in bold in parentheses. Growth of ridges is interpreted to represent emplacement of ice-lateral stacks of volcanic rocks forming planezes between glaciers (e.g. Conway et al. Citation2015). The reader is referred to Townsend et al. (Citation2017, Figure 72) for a series of time slice cartoons depicting this evolution.
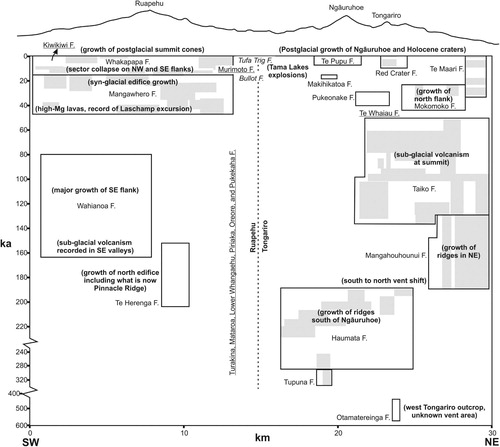
Figure 8. Relationships between ice-bounded lava flows confined to high topography, moraine-bounded glacial valleys, and post-glacial lava flows in-filling valleys on the north-western flank of Ruapehu (modified from Conway et al. Citation2015). Aerial photograph (upper panel) and draped simplified geology (lower panel; see for legend). The snowline is at about 1700m elevation in this image. GNS Science photo by Dougal Townsend
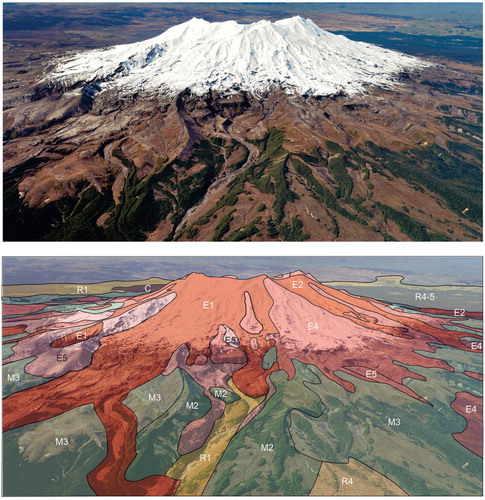
Figure 9. Examples of eruptive materials comprising the edifices and ring plains. A: Tabular ice-marginal lava flows exposed in the Whangaehu valley wall, Ruapehu, inferred to have been confined against a retreating Whangaehu Glacier. Some flows have quenched glassy knuckles and lobes (k), where the lava excavated cavities in the glacier margin, and they overlie or intrude till (t). The lava (wim) that forms the c. 30 m high waterfall is interpreted to have been emplaced subglacially in a meltwater tunnel when the Whangaehu Glacier occupied this gorge, creating an internal mould of the tunnel. The rubbly lava flow (wc) is from Te Wai ā-Moe/Crater Lake and was deflected from entering the gorge by the glacier, instead deviating along the higher margin of the gorge to the left of the photo. GNS Science photo by Dougal Townsend; B: Characteristic cooling fractures orientated perpendicular to the margin of ice-bound lava, formed by quenching when the lava contacted ice. Photo by Colin Wilson; C: Bedded lapilli tuff deposits bearing fluidal bombs with quenched rinds. Bombs (b) are aligned parallel to bedding and their basal surfaces scour the underlying bedding, rather than form impact sag structures. The bombs are ∼ 30 cm in diameter. Bedding is lenticular (lb) and defined by grain size variations with individual beds well sorted. Traction structures indicate emplacement from water along the steep summit ridgeline of Tongariro volcano. The lapilli tuffs are interpreted as subaqueous density current deposits emplaced in meltwater channels confined by a summit ice cap. Photo by Rosie Cole. D: Airfall ash and lapilli aged between c. 25 and 12 ka mantle blocky distal lava flows (to the left) from Ruapehu volcano near the Desert Road. The bank of tephra at right is about 3 m high. GNS Science photo by Dougal Townsend.
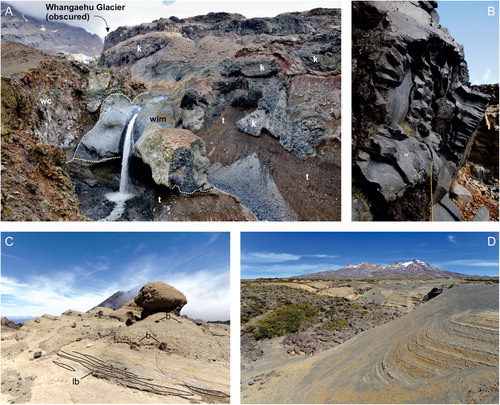
Figure 10. Summary of time, volume and composition variations of mapped units at Ruapehu and Tongariro volcanoes based on radiometric dating by Gamble et al. (Citation2003) and Conway et al. (Citation2016) for Ruapehu, and Pure et al. (Citation2020) for Tongariro. A: Cumulative erupted volumes of Tongariro map units (left axis) and Ruapehu’s total edifice (right axis), adapted from Pure et al. (Citation2020) and Conway et al. (Citation2016), respectively. For Ruapehu: TH: Te Herenga Formation, WA: Wahianoa Formation, MA: Mangawhero Formation, WH: Whakapapa Formation. B: Benthic δ18O global climate proxy record from Lisiecki and Raymo (Citation2005) with approximate positions of Marine Isotope Stage (MIS) periods shown. Blue shading indicates periods of valley-filling glaciers and ephemeral summit ice caps on Tongariro and Ruapehu as inferred by field geology (Conway et al. Citation2016; Townsend et al. Citation2017; Cole et al. Citation2018, Citation2019; Pure et al. Citation2020). C: Chronological variations in K2O for Tongariro (dark crosses) and Ruapehu (red boxes and crosses). Cross heights show the variation in sample concentrations for each map unit; cross widths show minimum and maximum possible age range for each map unit. Ruapehu data from Gamble et al. (Citation2003), Conway et al. (Citation2016, Citation2018), and Tongariro data from Hobden et al. (Citation1996), Townsend et al. (Citation2017) and Pure et al. (Citation2020). D: As for ‘C’ but for MgO. Thick grey lines show regressions between Tongariro data points as presented in Pure et al. (Citation2020).
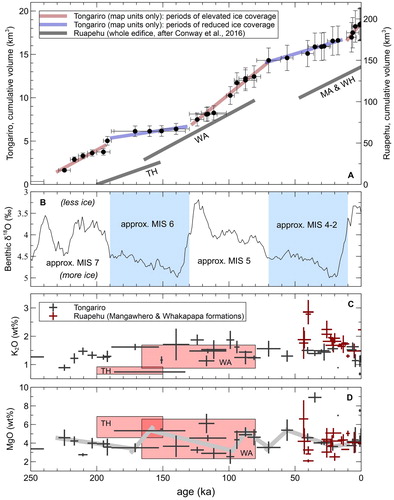
Figure 11. A: View of Ruapehu’s Summit Plateau (SP) and Te Wai-ā-Moe/Crater Lake looking north, modified from Townsend et al. (Citation2017). The collapse of a cone that had formed on the northern summit prior to the Holocene (between the Paretetaitonga and Te Heuheu peaks) led to the Murimoto Formation debris avalanche () near Whakapapa, possibly as further ice loss debuttressed its support. That scarp was then filled in with the early Holocene cone beneath the Summit Plateau. A similar process in the lead up to the Holocene occurred with the building of a cone in the foreground, which then collapsed to the right (eastward). The scar then filled in with a cone, the crater of which is now occupied by Te Wai ā-Moe/Crater Lake. B: View of Tongariro looking north, including the older, eroded Tama Lakes (TL) area lavas and Pukekaikiore (P) cone, and the Holocene cones and vents of Ngāuruhoe (Ng), North Crater (NC), Red Crater (RC). Lakes Rotoaira (LR) and Taupo (LT) are to the north, and Oturere valley (OV) trends east from the high peaks of the Tongariro edifice. The King Country (KC) lies to the west.
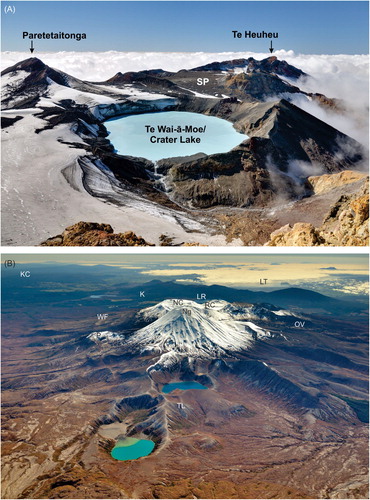
Figure 12. Geophysical data from Ruapehu and Tongariro. A: Vp data beneath Ruapehu and Tongariro (top). B: Vp/Vs ratios at 3 (upper) and 9 km (lower) depth beneath Tongariro. A and B reproduced as authorised by the publisher from and of Rowlands et al. (Citation2005). C: 2D resistivity model beneath Ruapehu reproduced as authorised by the publisher from of Ingham et al. (Citation2009). Note that this is a 2-D inversion of a single line of data over Mount Ruapehu, much less reliable than a 3-D inversion. D and E: resistivity in plan (at 2.5 km depth) and section view of 3D MT model at Tongariro (modified from Hill et al. Citation2015). The closed 100 ohm-m contour in ‘D’ indicates the approximate extent of hydrothermal alternation. F: Self-potential anomalies at Tongariro (modified from Miller et al. Citation2018a). Self-potential data points are shown by the black dotted line. The purple dashed line outlines the extent of hydrothermal alteration from magnetic data and the orange dashed line outlines surface thermal features. Red and blue triangles are hydrothermal and groundwater springs, respectively, and the red star indicates the 2012 eruption vent.
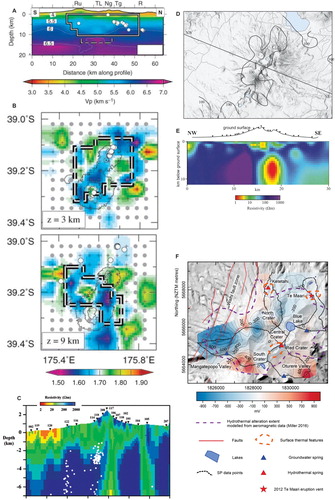
Figure 13. Representative figures to show compositional variations from mapped lavas on Ruapehu (blue) and Tongariro (red) volcanoes, based on data from Conway et al. (Citation2016, Citation2018) and Pure et al. (Citation2020). The plots are supplemented by published data from Hobden et al. (Citation1997) for Tongariro, and Price et al. (Citation2012) for Ruapehu. The TAS fields in panel A, defining basaltic andesite, andesite and dacite, are from Le Bas et al. (Citation1986).
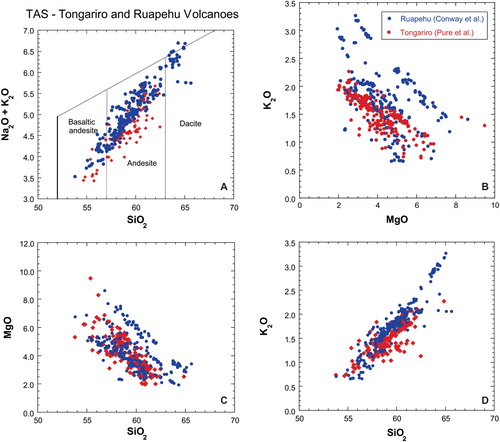
Figure 14. View of Ngāuruhoe cone looking south across the Mangatepopo valley, with annotations of eruption products. Recent lava and pyroclastic deposits sourced from Ngauruhoe overlie older Tongariro lavas exposed in cliffs. GNS Science photo by Dougal Townsend.
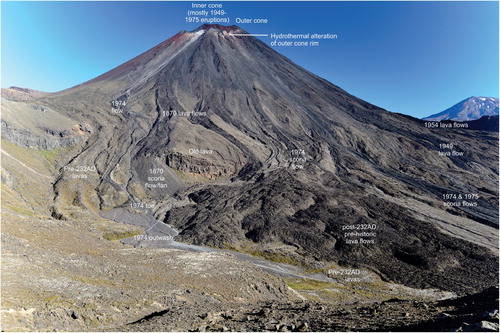
Figure 15. Timing and scales of historic eruptions at Tongariro and Ruapehu volcanoes. Eruptions at Tongariro are coloured by the active vent. The largest examples of historic events at both volcanoes reach the equivalent of Volcanic Explosivity Index 3 (VEI: Newhall and Self Citation1982). Modified from Townsend et al. (Citation2017).
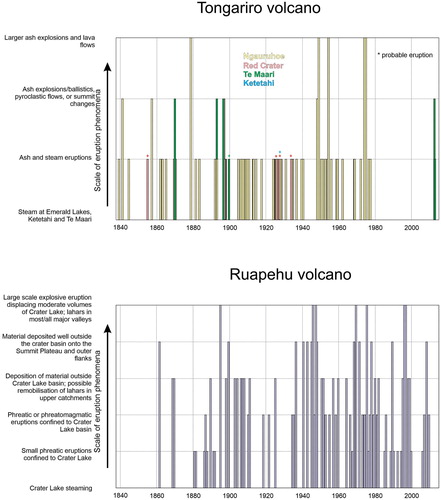
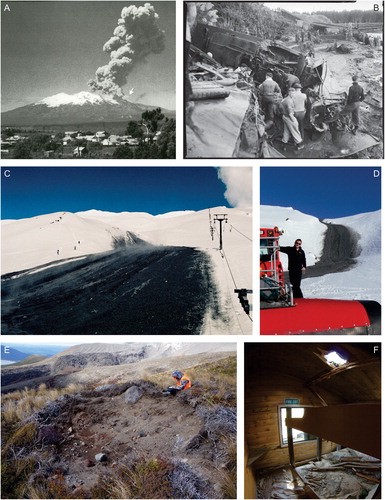
Figure 16. Photographs to illustrate the range and scale of hazards resulting from recent eruptions at Ruapehu and Tongariro. A: PDC (white arrow) formed from eruption-column collapse during the 1945 Ruapehu eruption, looking northeast from Raetihi (Photo: N. Mosen, Lansdown Collection). B: Aftermath of the Tangiwai Disaster on 24 December 1953, following the 1945 eruption of Ruapehu volcano. The Whangaehu River was occupied by a lahar from the collapse of the Te Wai-ā-Moe/Crater Lake outlet barrier, washing away the bridge with the train and carrying carriages downstream. Source: Peacock, Morice Gladstone, 1916–1995: Negatives, prints, register and minute book from twentieth Century Photography studio, Taumarunui. Ref: MP-0059-11-F. Alexander Turnbull Library, Wellington, New Zealand. /records/22808804. C: Ice slurry lahar deposit from the September 23, 1995 Ruapehu eruption alongside the Far West T-Bar on Whakapapa Ski Area (Photo: GNS Science). D: An ice slurry lahar deposit from the 25 September 2007 Ruapehu eruption narrowly missed this snow groomer on Whakapapa Ski Area, adjacent to the Far West T-Bar (Photo: Graham Leonard, GNS Science). E: Crater formed by a ballistic block launched 1.4 km during the August 6, 2012 Tongariro eruption at Te Maari (Photo: Rebecca Fitzgerald); F: Damage to the ceiling and bunks of the Ketetahi Hut from Te Maari ballistic block impacts 1.4 km from the vent during the August 6 2012 eruption (Photo: Nick Kennedy).
Data availability statement
Data sharing is not applicable to this article as no new data were created or analysed in this study.