Figures & data
Figure 1. Model of the hypothesized relationship tested in the first research question.
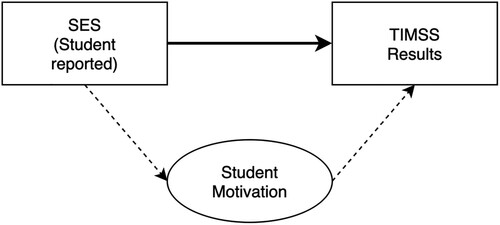
Figure 2. Model of the hypothesized relationship tested in the second research question.
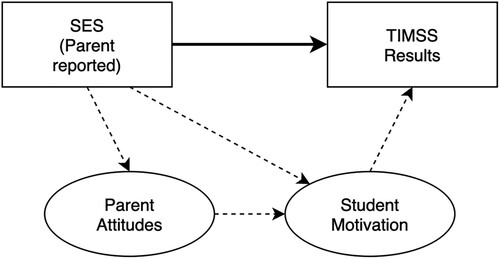
Table 1. Student reported number of books in the home.
Table 2. Parent reported number of books in the home.
Figure 3. Path Analysis Structural Equation Model with Two Motivation Constructs Using Student Data. Note: Total effect of SES on results including all mediating paths: .33*** (.02). Residual correlation between self-concept and intrinsic motivation was .68*** (.02). Standard errors are estimated with 1000 bootstrap iterations. Controlled for age and gender. *p < .05 **p < .01 ***p < .001.
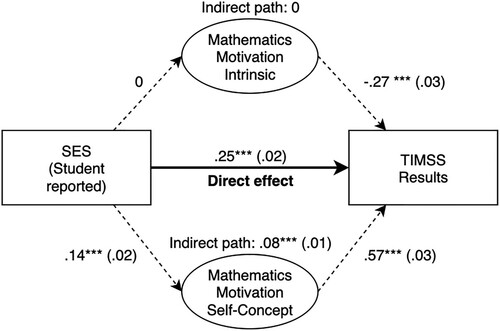
Figure 4. Path Analysis of Student Data with an Self-Concept Motivation Factor. Note: Total association between SES and results, all direct and indirect paths 4: .32*** (.02). Controlled for age and gender. * p < .05 ** p < .01 ***p < .001.
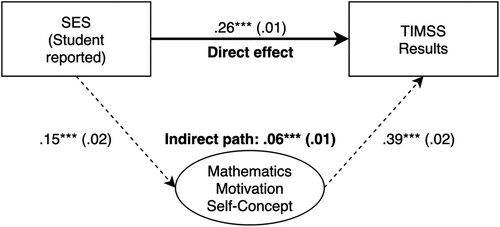
Figure 5. Path Analysis of Student Data with an Intrinsics Motivation Factor. Note: Total association between SES and results, all direct and indirect paths 5: .33*** (.02). Controlled for age and gender. * p < .05 ** p < .01 ***p < .001.
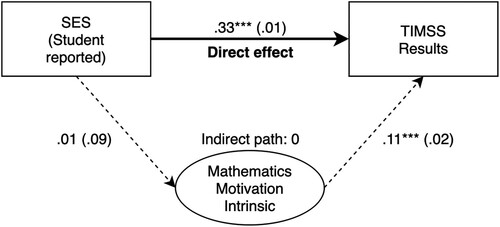
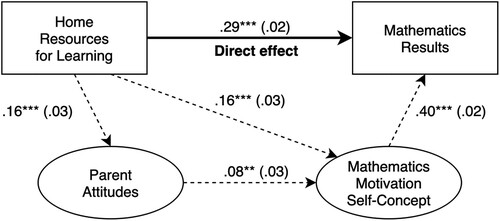
Figure 6. Path Analysis of Structural Equation Model with Parent- and Student Data, Including One Motivation Factor (Self-Concept) and Parental Attitudes. Note: Total effect of SES on results including all mediating paths: .36 *** (.02). Effect through attitude-motivation path: .005* (.002). Effect through only motivation: .06*** (.01). Controlled for age and gender. *p < .05 **p < .01 ***p < .001.