
Figures & data
Table 1. Characteristics of the reports evaluated in this study.
Figure 1. Harshness in reviewers’ reports as a function of the seasons of the year. For each season, the icons size is scaled according to the mean values of harshness in that season (reported alongside it), and a bar plot with the percentage of reviews with each score of harshness (1–5) is provided.
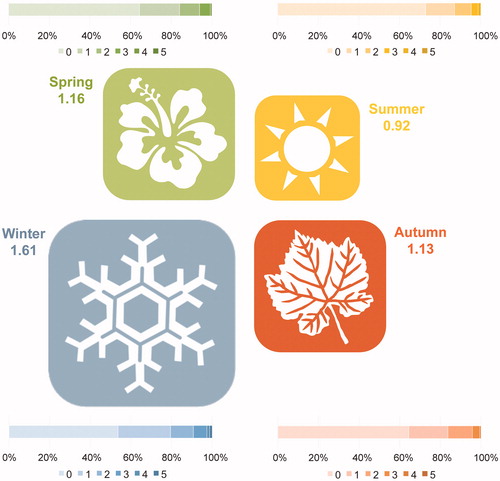
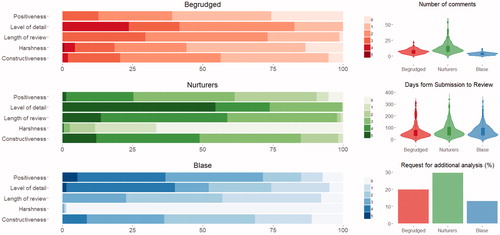
Figure 2. The three subtypes of peer reviewers. These subtypes differed in terms of levels of: positiveness, detail, constructiveness and harshness; and in length of reviews. Further, differences were found in: number of comments, days from submission of the manuscript to review and whether they requested additional analyses to be carried out.
Supplemental Material
Download PDF (2.7 MB)Data availability statement
All data generated for this study is available upon request.