
Figures & data
Figure 1. Flowchart of the development of the resident questionnaire.
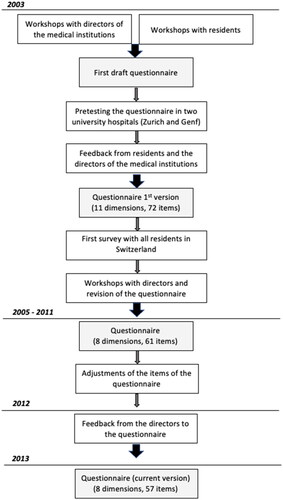
Table 1. Data of the eight scales from the survey year 2020. Valid cases (N), mean values (M), standard deviations (SD), and Cronbach’s alpha.
Table 2. Results of the linear regression analysisa with overall assessment as the dependent variable for the overall sampleb.
Table 3. Mean values (M) of the eight scales since 2005. .
Table 4. Percentages of directors’ responses to the statement ‘The results of our medical training site were fair’ 2005–2009.
Table 5. Percentage of directors’ responses to the statement ‘The results of the survey made me rethink our postgraduate training‘ 2005–2009.
Table 6. Percentage of directors’ responses to the statement ‘Feedback from the survey have motivated me to initiate changes‘ 2005–2009.