Figures & data
Figure 1. Overview of study design.
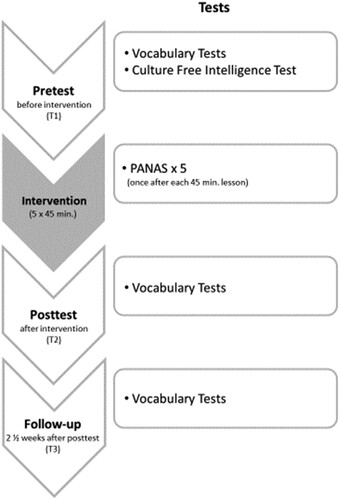
Figure 2. Productive vocabulary at Times 1, 2, and 3 (aggregated mean scores and standard errors from Productive Vocabulary Test 1 and Test 2)
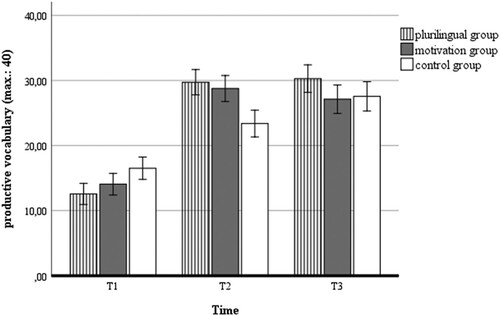
Figure 3. Receptive vocabulary at Times 1, 2, and 3 (aggregated mean scores and standard errors from Receptive Vocabulary Test 3 and Test 4).
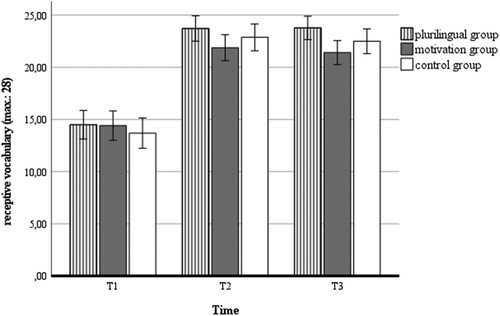
Table 1. Performance productive vocabulary tests (max. 40): Means (standard deviations) for three groups at T1, T2, and T3.
Table 2. Performance receptive vocabulary tests (max. 28): Means (standard deviations) for both groups at T1, T2, and T3.
Table 3. Performance productive vocabulary tests with correct spelling (max. 40): Means (standard deviations) for both groups at T1, T2, and T3.
Figure 4. Productive vocabulary at Times 1, 2, and 3 (aggregated mean scores and standard errors from Productive Vocabulary Test 1 and Test 2, correct spelling required).
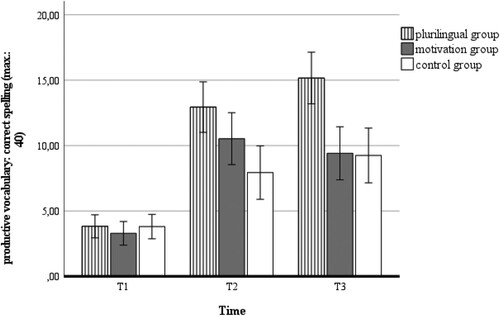
Table 4. Positive and negative affect in the three groups (min. 1/ max.3): Means (standard deviations) from five lessons for the three groups.
Figure 5. Positive affect during the intervention: Mean scores and standard errors for all groups after Lesson 2, 3 and 4.
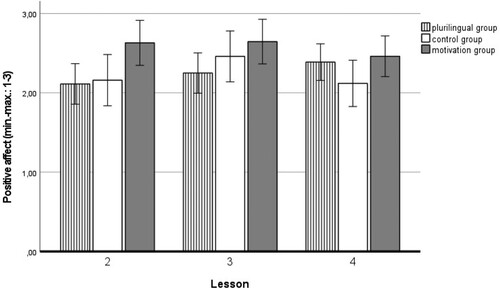
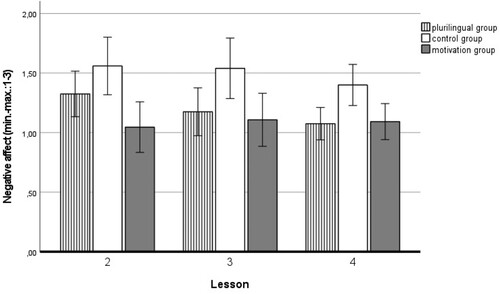
Figure 6. Negative affect during the intervention: Mean scores and standard errors for all groups after Lesson 2, 3, and 4.