
Figures & data
Figure 1. CTC(M-1) Model 1. HS: hope for success; FF: fear of failure; MAP: mastery-approach; MAV: mastery-avoidance; PAP: performance-approach; PAV: performance-avoidance; g: general; d: domain. Residuals are not shown.
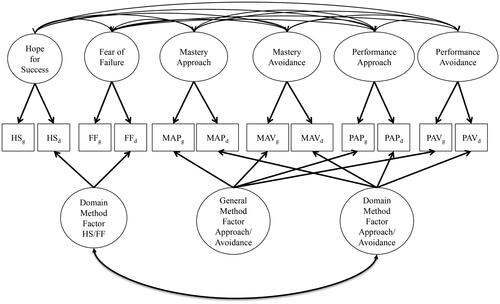
Figure 2. CTC(M-1) Model 2. HS: hope for success; FF: fear of failure; MAP: mastery-approach; MAV: mastery-avoidance; PAP: performance-approach; PAV: performance-avoidance; g: general; d: domain. Residuals are not shown.
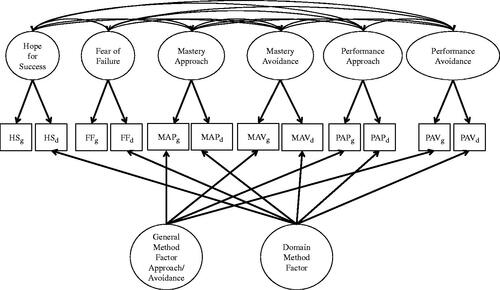
Table 1. Standardised regression weights of the latent variables on the different scales, and consistency and method-specificity of these scales – Study 1.
Table 2. Regressions of grades on constructs and math-specific method factor – Study 1.
Table 3. Bivariate correlations between all specific predictors and zero-order correlations between all specific predictors and the criteria – Study 2.
Table 4. Standardised regression weights of the latent variables on the different scales, and consistency and method-specificity of these scales – Study 2.
Table 5. Regression results – Study 2.
Appendix 1. Descriptive statistics, internal consistencies, and correlational patterns of general and domain-specific achievement motivation and grades.
Appendix 4. Ranges, means, standard deviations, and internal consistencies for all used variables in Study 2