Figures & data
Table 1. Descriptive and reliability statistics.
Table 2. Fit statistics, entropy, and profile size for various profile solutions.
Figure 1. The final three derived profiles (standardised scores; mean = 0). Note. shows significant differences in the profile indicator variables (science anxiety, science self-efficacy, EDA during science task) across the profiles.
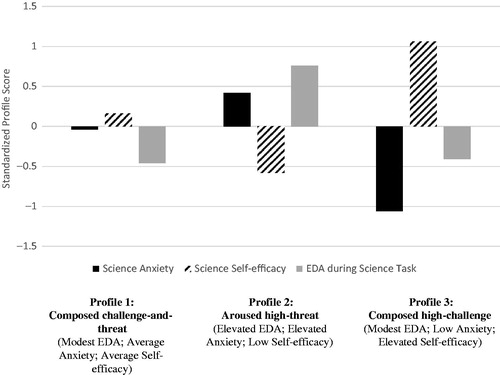
Table 3. Latent profile analysis solution and significant mean differences in latent profile indicators.
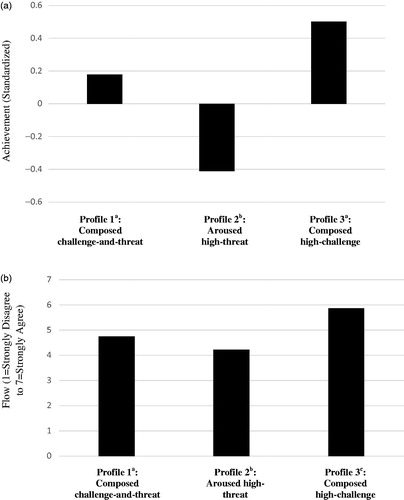
Figure 2. (a) Differences across profiles in science test achievement. Note: Different superscripts indicate two profile groups significantly different on achievement, p < .05. (b) Differences across profiles in science flow. Note. Different superscripts indicate two profile groups significantly different on flow, p < .05.