
Figures & data
Figure 1. Calculated Euclidean distance hierarchically clustering matrix, indicating correlations between the scores of all subcriteria of all 13 categories of all numerated rubrics. The color range in the legend indicates the Pearson correlations between the subcategories (pink = Pearson correlation of 0.0, green = Pearson correlation of 1.0). The subcriteria are ordered based on the similarity in scores, also indicated by the dendogram on the left. Hence, subcriteria that are scored similarly, such as the discussion overview and discussion line of thought, are directly connected in this dendogram. The dendogram is calculated based on Euclidean distance hierarchically clustering.
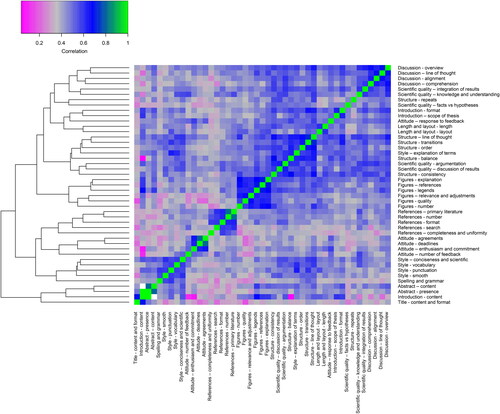
Figure 2. Trendline (blue) of the correlation between thesis grade and the mean score of the 13 subcriteria of the assessed rubric. Boxes behind the trendline indicate the median and variation in rubric score per grade. Shown are the boundaries of the second and third quartile of the data distribution. Black bars within the boxes indicate the median and whiskers the Q1 and Q4 values within 1.5 times the interquartile range. Individual dots are outliers beyond the Q1 and Q4 intervals.
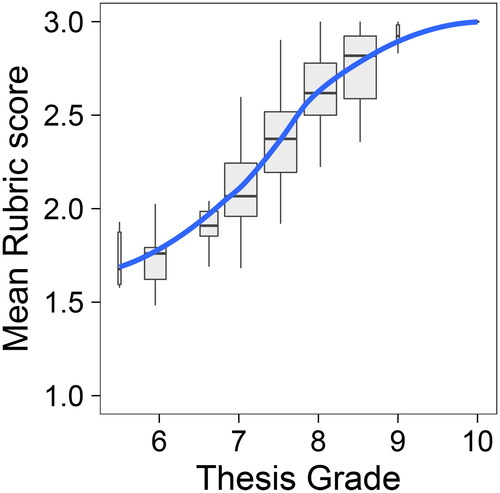
Figure 3. Multiple linear regression analysis of thesis grade and criteria scores for all theses and for theses graded as sufficient (≤7.0), good (<7.0 and ≤8.0), and excellent (>8.0). The grey bars indicate standard deviations.
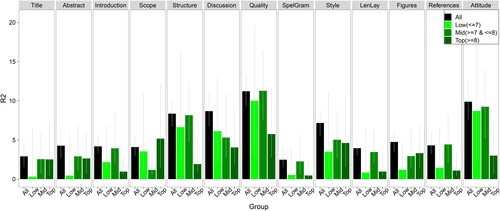
Table 1. Descriptive statistics for criteria scores of all rubrics used in the assessment of bachelor theses in biology.
Table 2. Regression analysis of thesis grade bins and criteria scores adjusted for interdependence between criteria scores. The regression analysis is performed separately for three bins; sufficient thesis grades (left column, <7.0; n = 48), good thesis grades (grades ≥ 7.0 to <8.5; n = 158) and excellent thesis grades (grades ≥ 8.5; n = 55).
Figure 4. Frequency distribution of criteria scores of the 13 rubric categories for theses graded as sufficient (≤7.0), good (<7.0 and ≤8.0), and excellent (>8.0). Criteria scores are color coded from red (criteria scores from 1 to 1.22) to green (criteria scores from 2.78 to 3).
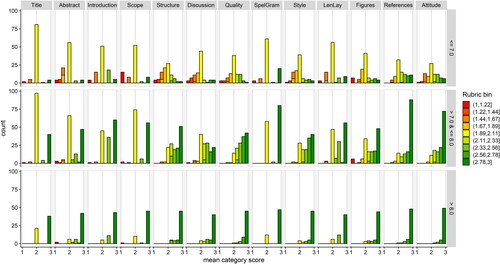
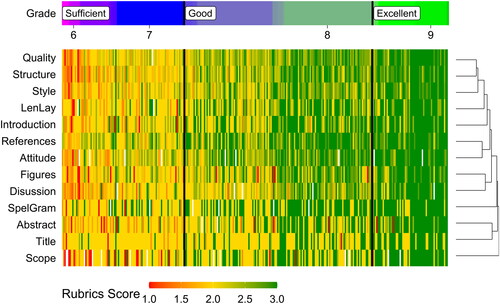
Figure 5. Average rubric criteria scores (rows) of all 318 assessed biology bachelor theses (columns). The 318 bachelor theses are sorted in columns from lowest thesis grade (left) to highest thesis grade (right) with thick black vertical lines marking the boundaries of the three separate grade bins: sufficient (≤7.0), good (<7.0 and ≤8.0), and excellent (>8.0). The criteria scores of each thesis are presented with color codes (red = sufficient, yellow = good and green = excellent). Criteria scores that were missing are marked in white. The criteria are ordered based on the similarity in scores, as indicated by the dendogram on the right. Criteria that are scored similarly, such as quality and structure or references and attitude, are directly connected in this dendogram. The dendogram is calculated based on Euclidean distance hierarchically clustering.
Appendix 1. Rubric used for assessing Biology bachelor theses at Utrecht University.