Figures & data
Table 1. Descriptive statistics of system-level variables.
Figure 1. Turnover intentions in the 2018 TALIS Teacher Questionnaire.
Figure 2. Teacher turnover intentions and classroom socioeconomic composition .
Figure 3. Cross-national relationships between accountability and classroom SES-based turnover intentions.
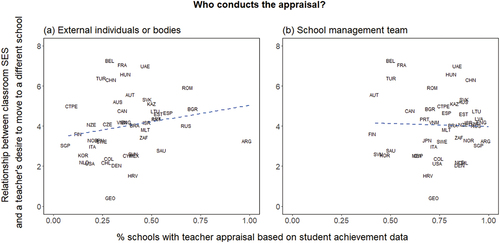
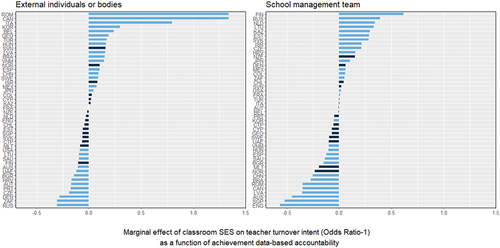
Figure 4. Three-level generalized linear estimates of teachers turnover intentions on classroom socioeconomic composition.
Table 2. Estimates from successive three-level generalized models.
Table 3. Estimates from three-level random slope models by school consequence subgroup.
Table 4. Estimates from three-level random slope models by teacher characteristic subgroup.
Table A1. Descriptive statistics.
Table C1. Teacher characteristics.
Table C2. School consequences of appraisal.
Note. Figure represents the coefficients for the interaction term classroom SES * achievement-based teacher appraisal (a dummy) regressed on teacher turnover intent. Statistically significant estimates shown in blue. Argentina and Norway are excluded due to no within-system variation in certain cases. Figure B shows the estimates from the within-country two-level logistic models. In these models, control variables include teacher gender, experience, self-efficacy, job satisfaction, school location, type, and socioeconomic composition. Positive estimates indicate an anti-compensatory general moderating effect of achievement-based teacher appraisal on SES-based turnover. The estimates are depicted as odds ratios minus one, and therefore signify marginal increases or decreases in the odds of wishing to change schools in percentage points. This is a random-intercepts model only, as in the majority of education systems, the teacher mobility intentions-classroom SES slope did not vary as a function of accountability at the school level.