
Figures & data
Figure 1. The distribution of the test anxiety scale and GCSE total points scores. (a) Test anxiety. (b) GCSE total points score.
Both measures have been standardised to mean zero and standard deviation one. The figures running along the horizontal axis hence refer to the standardised values.
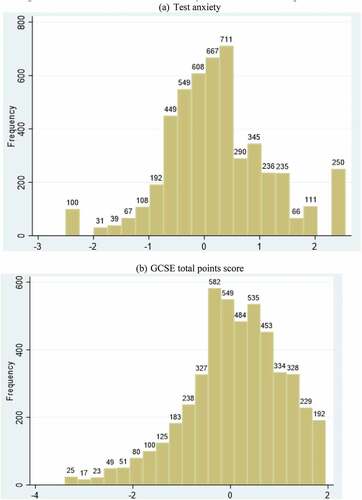
Table 1. The distribution of responses to each of the test anxiety items.
Figure 2. The link between test-anxiety decile and GCSE grades. (a) Total GCSE point scores. (b) GCSE mathematics grades.
Figures in panel (a) refer to effect sizes, while those in panel (b) refer to differences in grades. Graph can be cross-referenced with (with additional details on model specifications provided in the table notes). Positive (negative) values indicates higher (lower) GCSE grades. ‘Demographics’ refer to estimates from Model M2 (demographics and school fixed-effects controlled). ‘PISA controls’ refer to estimates from Model 3 (demographics, school fixed-effects and PISA scores controlled). ‘PISA + KS2’ refer to estimates from Model M5 (demographics, school fixed-effects, PISA scores and Key Stage 2 scores controlled).
Table 2. The link between test-anxiety decile and GCSE grades (parameter estimates).
Supplemental material