
Figures & data
Figure 1. Idealised ‘model of parental needs’ which may be targeted by children’s centres (Evangelou et al., Citation2014).
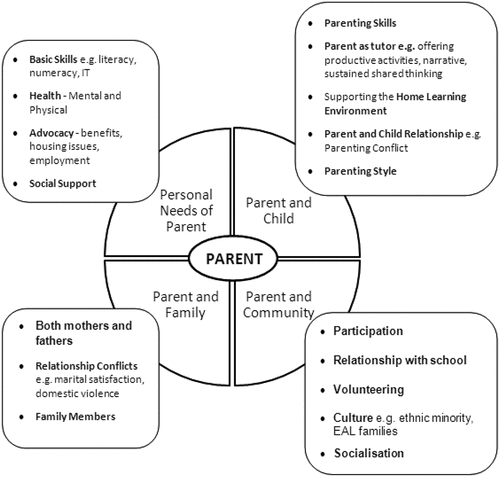
Figure 2. The EvCCE sampling frame for different strands of the national evaluation (Sammons, Hall et al., Citation2015).
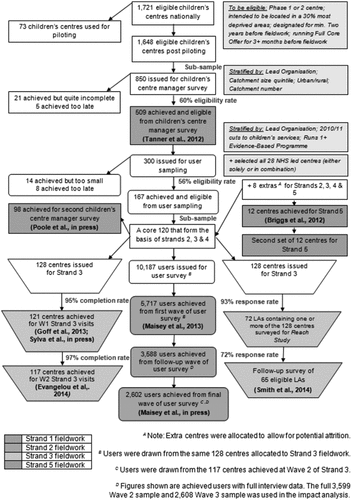
Figure 3. Identifying children’s centre ‘impacts’ on child, parent & family outcomes with a clustered sample (2600+ children and families from 117 centres) based on multilevel statistical models (Sammons, Hall et al., Citation2015).
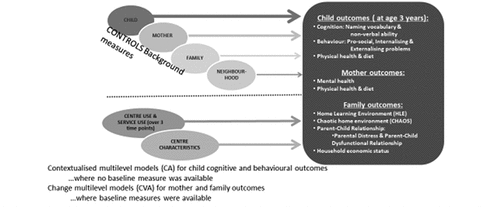
Figure 4. Overview of positive impacts of children’s centres on outcomes (Sammons, Hall et al., Citation2015).
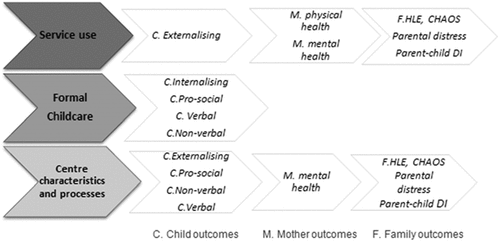
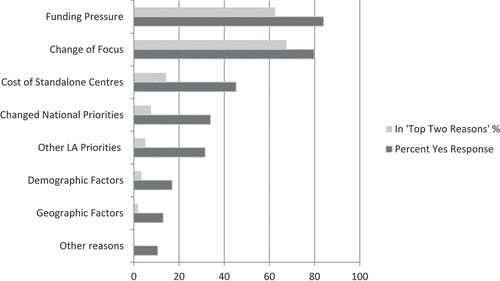
Figure 5. Principal reasons for major changes in children’s centre provision (Smith et al., Citation2018).
Data availability statement
Data sharing is not applicable to this article as no new data were created or analysed in this paper.