
Figures & data
Figure 1. shows the PRISMA flow diagram, which we adopted to evidence our systematic review and identification of the sub-corpus from Web of Science of n = 69 manuscripts (based on the structure offered by Page et al. Citation2021).
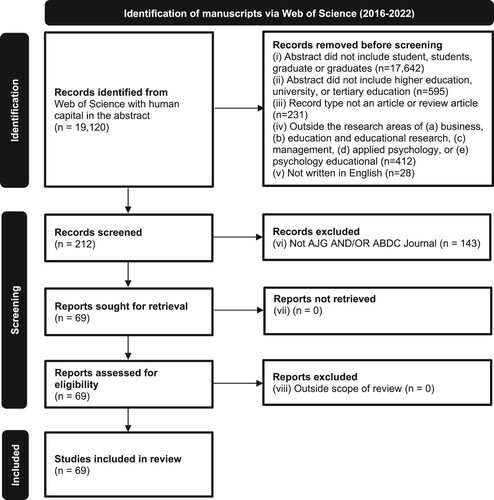
Figure 2. shows the PRISMA flow diagram, which we adopted to evidence our systematic review and identification of the sub-corpus from Scopus of n = 58 manuscripts (based on the structure offered by Page et al. Citation2021).
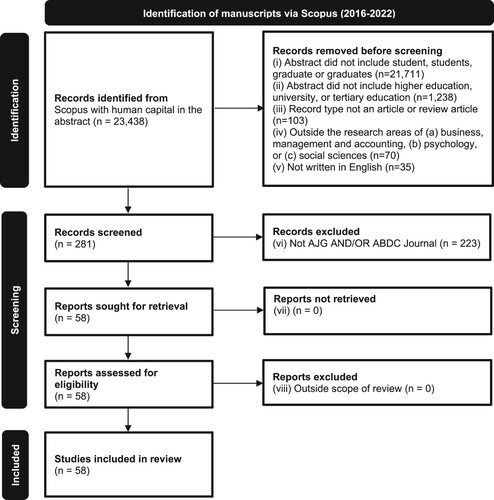
Figure 3. Summary of the nine forms of Employability Capital. © 2023 Authors. Used with permission.
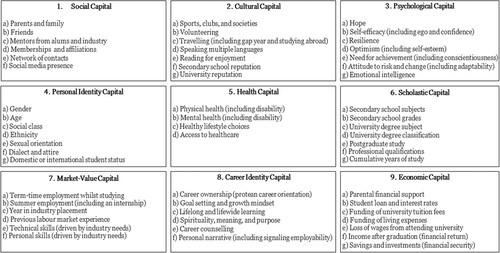
Figure 4. Employability Capital Growth Model (ECGM) © 2023 Authors. Used with permission.
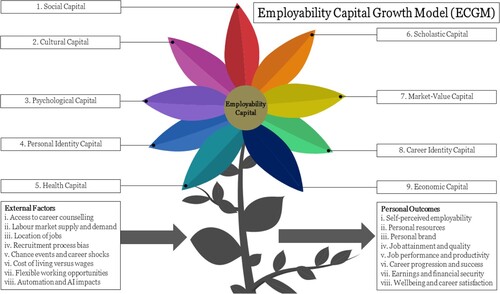
Table 1. Development of the Employability Capital Growth Model.
Table 2. Operationalisation of the Employability Capital Growth Model.