Figures & data
Table 1. List of some studies on kinetic modeling of the inactivation of micro-organisms during dynamic drying processes.
Table 2. Rate-dependent models tested in this study to describe the inactivation rate constant kd of Lactobacillus plantarum P8 inactivation during bread baking.
Figure 1. Experimental and simulated inactivation data of L. plantarum in the crust of 30 g bread during baking at different temperatures (experimental data: ×, 175 °C; *, 205 °C, ○, 235 °C; simulated data: ······, 175 °C; - - -, 205 °C; – ·· –, 235 °C), Simulated survival curves fitted with different rate-dependent models: (a) ∼ (f) for model No. 1 ∼ 6 in (R2, square of correlation coefficient). Error bars indicate the standard deviation of the experimental data.
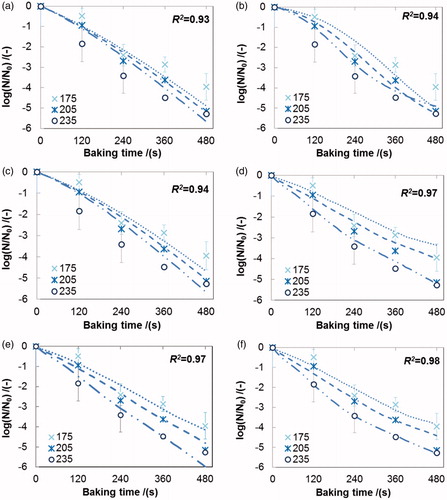
Table 3. Optimal parameters of the rate-dependent models based on the inactivation data of Lactobacillus plantarum P8 in the crust of 30 g bread.
Figure 2. Validation of the rate-dependent model No. 4 in using different inactivation datasets (a: 0.1 g; b: 5 g; c: 60 g) and a parity plot of the experimental and the simulated values of the residual viability of L. plantarum in the crust during baking (d: ▲30 g, Δ 0.1 g, □ 5 g, ◊ 60 g). Lines represent predicted survival curves calculated using parameters derived from 30 g dataset; Error bars indicate the standard deviation of the experimental data, R2 the square of correlation coefficient.
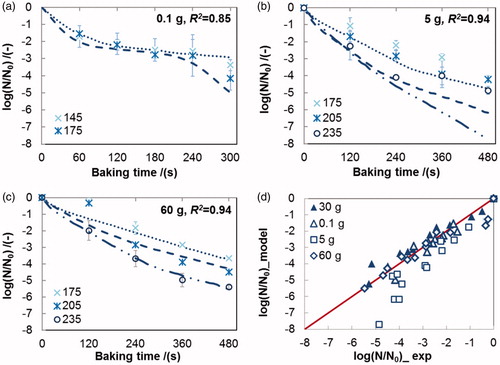
Figure 3. Validation of the rate-dependent model No. 6 in using different inactivation datasets (a: 0.1 g; b: 5 g; c: 60 g) and a parity plot of the experimental and the simulated values of the residual viability of L. plantarum in the crust during baking (d: ▲30 g, Δ 0.1 g, □ 5 g, ◊ 60 g). Lines represent predicted survival curves calculated using parameters derived from 30 g dataset; Error bars indicate the standard deviation of the experimental data, R2 the square of correlation coefficient.
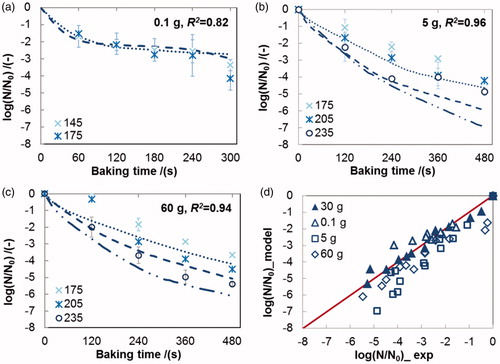
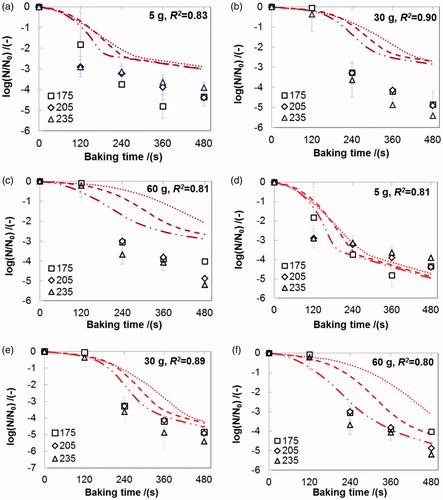
Figure 4. Experimental and simulated inactivation data of L. plantarum in the crumb of bread during baking at different temperatures (experimental data: □, 175 °C; ◊, 205 °C, Δ, 235 °C; simulated data: ······, 175 °C; - - -, 205 °C; – ·· –, 235 °C), Simulated survival curves fitted with different rate-dependent models: (a) ∼ (c) for model No. 4 and (d) ∼ (f) for model No. 6 in (R2, square of correlation coefficient). Error bars indicate the standard deviation of the experimental data.