
Figures & data
Table 1. Teachers’ (N = 16) mean scorings and standard deviations from observations with TIS-S for children with SEN, children without SEN, and all children; factor loadings from PCA
Figure 1. The Cohen’s d from observations with Teacher Impression Scale Swedish version (TIS-S) between children without special educational needs (SEN) and children with SEN is shown in the above Gardner-Altman estimation plot. Both groups are plotted on the left axes; the mean difference is plotted on a floating axis on the right as a bootstrap sampling distribution. The mean difference is depicted as a dot; the 95% confidence interval is indicated by the ends of the vertical error bar (Ho et al. Citation2019).
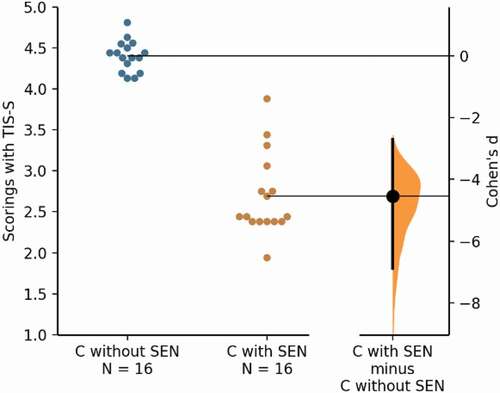
Table 2. Teachers’ (N = 16) perceptions of using TIS-S for social play observations in inclusive preschools
Table 3. Teachers’ (N = 16) perceptions of using TIS-S for social play observations in inclusive preschools