
Figures & data
Figure 1. Messages presented on the alcohol labels in each condition.
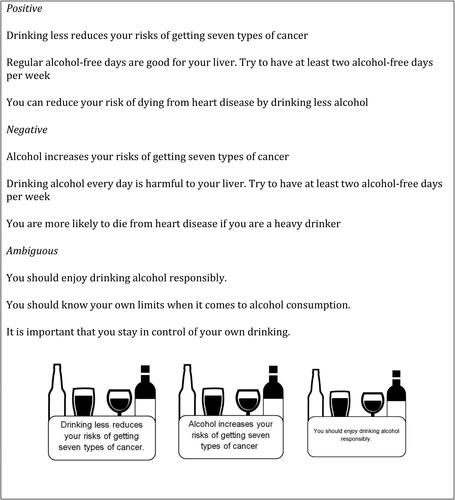
Table 1. Sample characteristics including AUDIT scores and prototype perceptions by condition.
Table 2. Perceptions of each label in the study in terms of awareness, believability, relevance, and whether each individual label would make participants consider drinking less.
Table 3. Comparison of study outcome measures by condition with ANOVA test statistics and p-values.
Table 4. Results of four moderation models exploring whether prototype perceptions moderated the impact of condition on drinking intentions with positive messages as the reference group.
Figure 2. The interaction between condition and responsible drinker favourability.
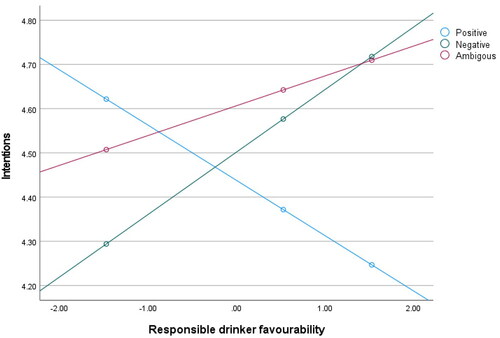
Figure 3. The interaction between condition and responsible drinker similarity.
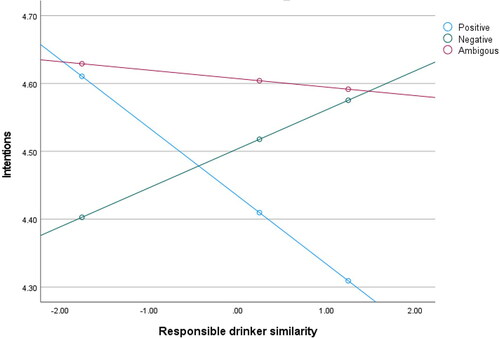
Table 5: Correlations between prototype perceptions and AUDIT scores.
Supplemental Material
Download MS Word (53.1 KB)Data availability
The data that support the findings of this study are available on the Open Science Framework.
