
Figures & data
Table 1. Research questions.
Table 2. Respondents’ rating of each voice’s characteristics.
Figure 1. Model illustrating the relationship between variables (vocal styles gender separated).
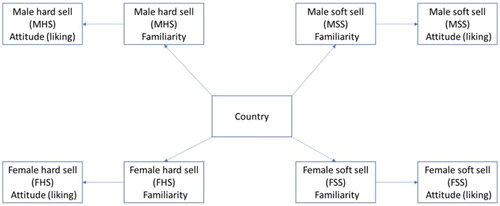
Figure 2. Model illustrating the relationship between variables (vocal styles gender combined).
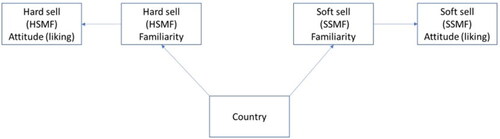
Table 3. Results of two-way ANOVA where group variable is attitude (liking) toward the vocal style and category variable is country.
Table 4. Mean difference between each voice within each country: attitude (liking).
Table 5. Results of two-way ANOVA where group variable is familiarity toward the vocal style and category variable is country.
Table 6. Mean difference between each voice within each country: familiarity.
Table 7. SEM results where independent variable is familiarity with the vocal style and dependent variable is attitude (liking) toward the vocal style (New Zealand).
Table 8. SEM results where independent variable is familiarity with the vocal style and dependent variable is attitude (liking) toward the vocal style (France).