Figures & data
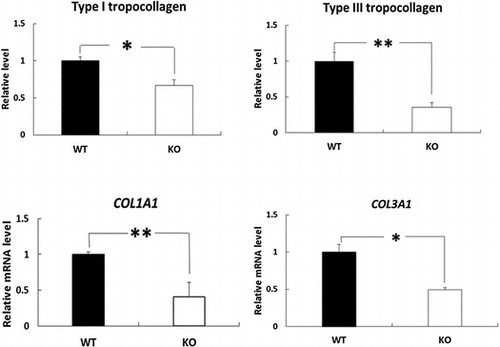
Figure 1. Effects of deletion of BDK on body weight in mice. Data are expressed as mean ± SE (n = 4).
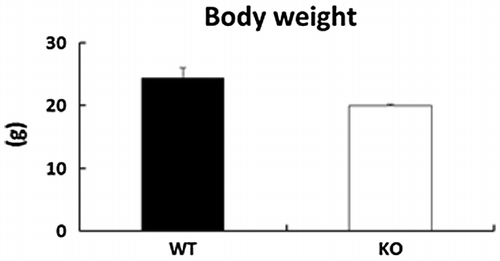
Figure 2. Effects of deletion of BDK on BCAA concentrations in the skin. BCAA levels were determined from the skin of WT and BDK-KO mice by the JLC-500/V amino acid autoanalyzer. Data are expressed as mean ± SE (n = 4). **p < 0.01 compared with WT mice.
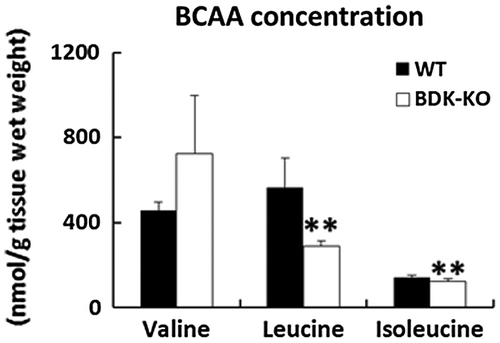
Figure 3. Effects of deletion of BDK on the levels of type I and type III tropocollagen proteins and COL1A1 and COL3A1 mRNAs in the skin. Type I tropocollagen (a) and type III tropocollagen (b) in the skin were evaluated by Western blotting and quantified. Density was expressed as a fold change relative to levels detected in WT mice. The mRNA levels of COL1A1 (c) and COL3A1 (d) in the rat skin were measured by quantitative PCR, and the values are expressed as the value relative to that of GAPDH. Data are expressed as mean ± SE (n = 4). *p < 0.05 and **p < 0.01 compared with WT mice.
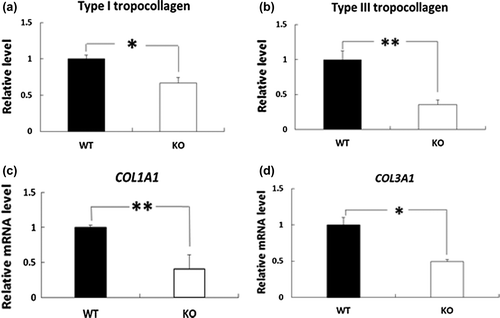
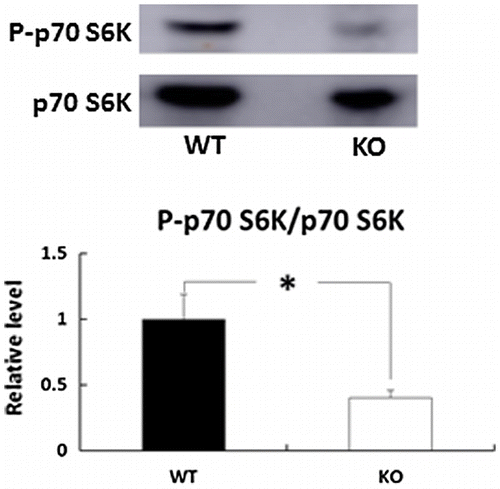
Figure 4. Effects of deletion of BDK on the phosphorylation status of p70 S6K in the skin. The phosphorylation of p70 S6K (Thr389) and p70 S6K protein levels was determined by immunoblot analysis. Bars are expressed as mean ± SE (n = 4). *p < 0.05 compared with WT mice.