986
Views
8
CrossRef citations to date
0
Altmetric
Special Issue: Functional Food Science

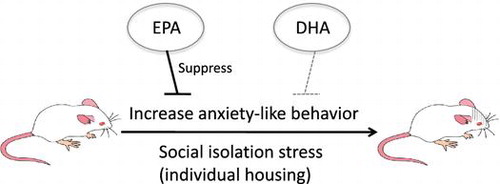
Effects of eicosapentaenoic acid and docosahexaenoic acid on anxiety-like behavior in socially isolated rats

, , , , , & show all
Pages 716-723 | Received 13 Oct 2017, Accepted 02 Nov 2017, Published online: 01 Dec 2017

Figures & data

Table 1. Composition of the diets (g/100 g of diet).

Figure 1. Performance in the elevated plus maze test. Open-arm time (A), open-arm frequency (B), head-dipping time (C), head-dipping frequency (D), stretch-out time (E), stretch-out frequency (F), locomotion time (G), and locomotion frequency (H) in rats fed control (CON), eicosapentaenoic acid-enriched (EPA), or docosahexaenoic acid-enriched (DHA) diets.
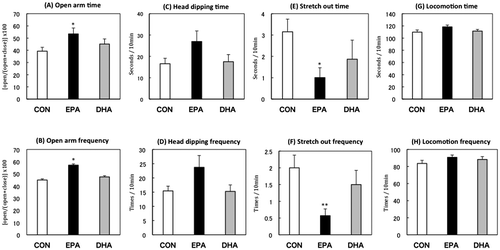
Values are presented as mean + SEM (n = 6 per group). *p < 0.05; **p < 0.01 vs. CON.
Figure 1. Performance in the elevated plus maze test. Open-arm time (A), open-arm frequency (B), head-dipping time (C), head-dipping frequency (D), stretch-out time (E), stretch-out frequency (F), locomotion time (G), and locomotion frequency (H) in rats fed control (CON), eicosapentaenoic acid-enriched (EPA), or docosahexaenoic acid-enriched (DHA) diets.
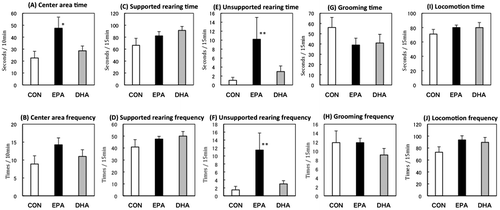
Figure 2. Performance in the open-field test. Center area time (A), center area frequency (B), supported rearing time (C), supported rearing frequency (D), unsupported rearing time (E), unsupported rearing frequency (F), grooming time (G), grooming frequency (H), locomotion time (I), locomotion frequency (J) of the rats fed control (CON), eicosapentaenoic acid-enriched (EPA), or docosahexaenoic acid-enriched (DHA) diets.

Values are presented as mean + SEM (n = 6 per group). *p < 0.05; ** p < 0.01 vs. CON.
Figure 2. Performance in the open-field test. Center area time (A), center area frequency (B), supported rearing time (C), supported rearing frequency (D), unsupported rearing time (E), unsupported rearing frequency (F), grooming time (G), grooming frequency (H), locomotion time (I), locomotion frequency (J) of the rats fed control (CON), eicosapentaenoic acid-enriched (EPA), or docosahexaenoic acid-enriched (DHA) diets.

Table 2. EPA and DHA contents in the phospholipid fraction of the cerebral cortex (%).

Figure 3. Performance in the elevated plus maze test. Open-arm time (A), open-arm frequency (B), head-dipping time (C), head-dipping frequency (D), stretch-out time (E), stretch-out frequency (F), locomotion time (G), locomotion frequency (H) of the rats fed control (CON) or eicosapentaenoic acid-enriched (EPA) diets, and group-housed (group) or individually housed (i.e. isolated).
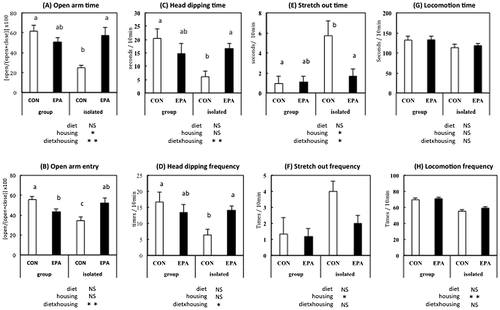
Values are presented as mean + SEM (n = 6 per group). Result of two-way ANOVA is shown below each graph (NS, not significant; *p < 0.05; **p < 0.01). Turkey’s test was further conducted when a significant diet × housing interaction was observed by two-way ANOVA. Different letters above the bars indicate statistically significant differences.
Figure 3. Performance in the elevated plus maze test. Open-arm time (A), open-arm frequency (B), head-dipping time (C), head-dipping frequency (D), stretch-out time (E), stretch-out frequency (F), locomotion time (G), locomotion frequency (H) of the rats fed control (CON) or eicosapentaenoic acid-enriched (EPA) diets, and group-housed (group) or individually housed (i.e. isolated).

Figure 4. Performance in the open-field test. Center area time (A), center area frequency (B), supported rearing time (C), supported rearing frequency (D), unsupported rearing time (E), unsupported rearing frequency (F), grooming time (G), grooming frequency (H), locomotion time (I), and locomotion frequency (J) of the rats fed control (CON) or eicosapentaenoic acid-enriched diet (EPA) and group-housed (group) or individually housed (i.e. isolated).
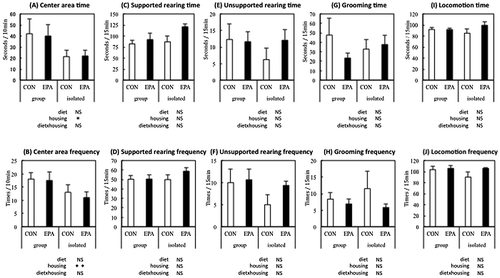
Values are presented mean + SEM (n = 6 per group). Results of two-way ANOVA is shown below each graph (NS, not significant; *p < 0.05; **p < 0.01).
Figure 4. Performance in the open-field test. Center area time (A), center area frequency (B), supported rearing time (C), supported rearing frequency (D), unsupported rearing time (E), unsupported rearing frequency (F), grooming time (G), grooming frequency (H), locomotion time (I), and locomotion frequency (J) of the rats fed control (CON) or eicosapentaenoic acid-enriched diet (EPA) and group-housed (group) or individually housed (i.e. isolated).

Table 3. Fatty acid composition of the cerebral cortex (%).

Reprints and Corporate Permissions

Please note: Selecting permissions does not provide access to the full text of the article, please see our help page How do I view content?

To request a reprint or corporate permissions for this article, please click on the relevant link below:

Academic Permissions

Please note: Selecting permissions does not provide access to the full text of the article, please see our help page How do I view content?

Obtain permissions instantly via Rightslink by clicking on the button below:

If you are unable to obtain permissions via Rightslink, please complete and submit this Permissions form. For more information, please visit our Permissions help page.