Figures & data
Table 1. The sample size from different schools, teachers with different teaching emphasis and used textbook.
Figure 1. The distribution of the responses for each item included in the final scale. The items are grouped by factors to which they belong (left side). The value in the middle of the bar represents the mean for each item (from 1 = strongly disagree to 5 = strongly agree). The item-related statistics are shown in Table S2 and S3. For the analysis, the items marked with R were reversed and the items in italics performed poorly and were removed.
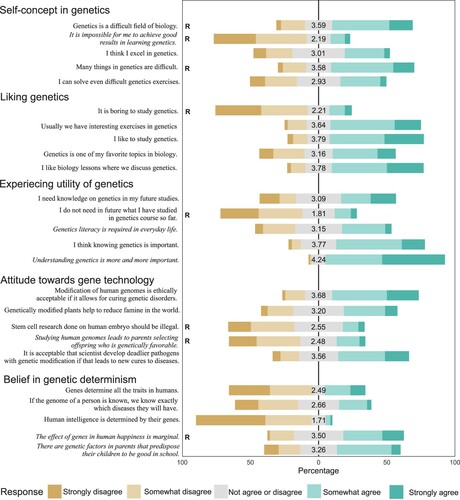
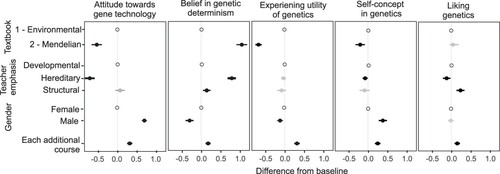
Figure 2. Links between student- and teacher-related variables and student attitudes. For each variable, one level is chosen as a baseline (Textbook 1, developmental emphasis of the teacher and female students) and this is represented by unfilled circles. Values substantially differing from baseline as shown with 95% confidence intervals are colored black, while values with no significant difference from baseline are colored gray.