
Figures & data
Table 1. Frequency statistics of categorical variables.
Table 2. Percentage of students across schools studying leaving certificate science subject.
Table 3. Percentage of students across schools with science knowledge & networks.
Figure 1. Differences in DEIS and non-DEIS students’ science study and career interest and confidence.
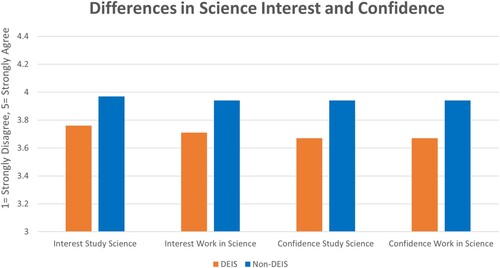
Table 4. Differences in DEIS and non-DEIS students’ science study and career confidence and interest.
Figure 2. Differences in DEIS and Non-DEIS students’ values, beliefs and expectations.
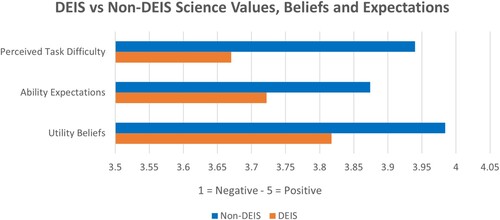
Table 5. Differences in DEIS and non-DEIS students’ science beliefs, expectations and perceptions.
Figure 3. Differences in DEIS and Non-DEIS students’ science career interest scales.
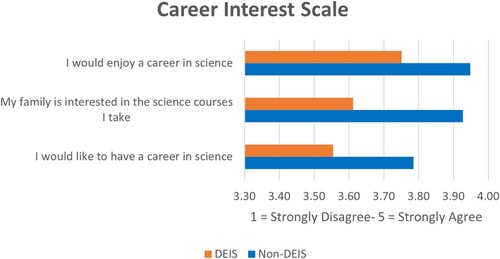
Table 6. Differences in DEIS and Non-DEIS students’ science career interest scales.
Data availability statement
The data that support the findings of this study are available on request from the corresponding author. The data are not publicly available due to privacy or ethical restrictions.