
Figures & data
Table 1. TPC and TEAC of raw samples and digested samples after in vitro digestion.
Figure 1. Alterations in the faecal bacterial community in different treatments. (a) Principal coordinates analysis (PCoA) plot showing the nonparametric microbial interdependence test (NMIT) distance at genus level to investigate the differences in microbiota profile between treatments using the time-based microbiota composition data. (b) Taxonomic cladogram showing the significantly discriminative taxa associated with different treatments by linear discriminant analysis (LDA) effect size (LEfSe) analysis (Kruskal–Wallis sum-rank test α < 0.05; LDA score > 2.00). The significantly discriminative taxa associated with each treatment is represented by different colour shading and the non-significant bacterial taxa is represented by the yellow dots.
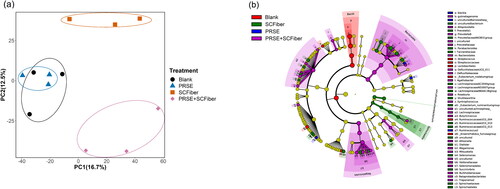
Table 2. Firmicutes/Bacteroidetes ratio of different samples after 24 h of in vitro colonic fermentation.
Figure 2. Changes in the relative abundances of the faecal microbial community in different treatments during the in vitro colonic fermentation. Relative abundances plot of the major bacterial genera (relative abundance > 0.5%) of blank, PRSE, SCFiber, and PRSE + SCFiber resulting from independent fermentation of each treatment at the 0, 3, 6, 12, and 24 h of in vitro colonic fermentation. Genera grouped as “Other” were those with relative abundance < 0.5%.
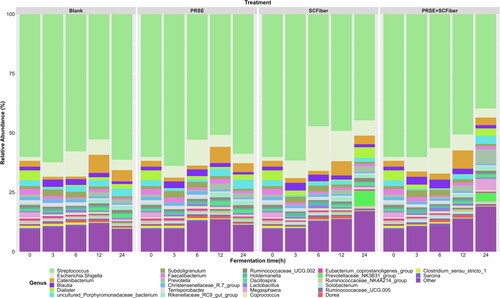
Figure 3. Concentration of short chain fatty acids produced throughout the in vitro colonic fermentation. (a) Total SCFA, (b) acetic acid, (c) propionic acid, (d) butyric acid, (e) iso-butyric acid, (f) valeric acid and (g) iso-valeric acid content (mmol/L fermenta) of blank, PRSE, SCFiber, and PRSE + SCFiber at the 0, 3, 6, 12, and 24 h of in vitro colonic fermentation. Each treatment was subjected to in vitro digestion and the digested precipitate was proceeded to in vitro colonic fermentation. Statistical significance (p < 0.05) of the results between different treatments is indicated by different letters in each plot and results are expressed as means ± SD (n = 3).
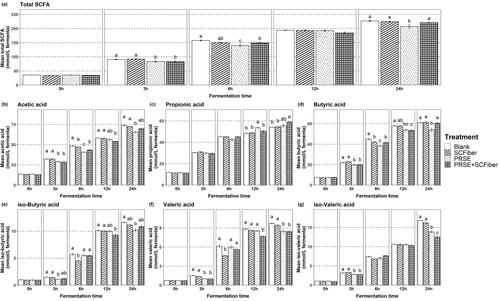
Figure 4. Correlations between specific bacterial genera and SCFA in different treatments. Spearman’s correlation heatmap of (a) blank, (b) PRSE, (c) SCFiber, and (d) PRSE + SCFiber showing the relationship between the changes in the relative abundances of major bacterial genera (relative abundance > 0.5%) and the changes in SCFA contents in different treatments. Positive correlations are indicated by green colours (r values > 0.6, FDR adjusted p < 0.05), while negative correlations are represented by pink colours (r values < –0.6, FDR adjusted p < 0.05). Other correlation coefficients are indicated by the colour scheme. Statistically significant correlations are marked with an asterisk ‘*’ (FDR adjusted p < 0.05).
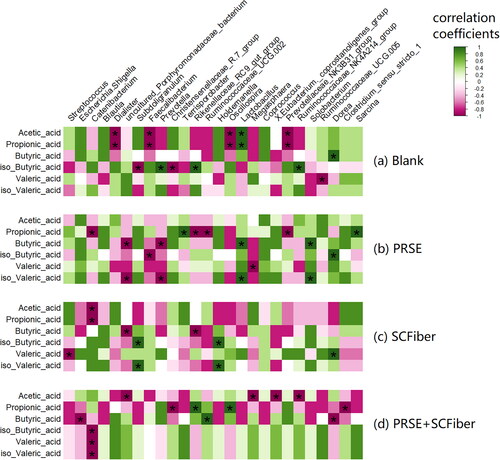
Table 3. Predicted metabolic pathways using PICRUSt2 analysis related to the significantly correlated pairs of bacterial genera and SCFAs from Spearman’s correlation result.