Figures & data
Figure 1. The territories of the two municipalities (enhanced black lines). The towns Örebro, Kumla and Hallsberg are circled in order to highlight the geographical relations. Map source: Lantmäteriets Geografiska SverigeData, 2020-01-24. Scale: 1 cm equals 4.2 km.
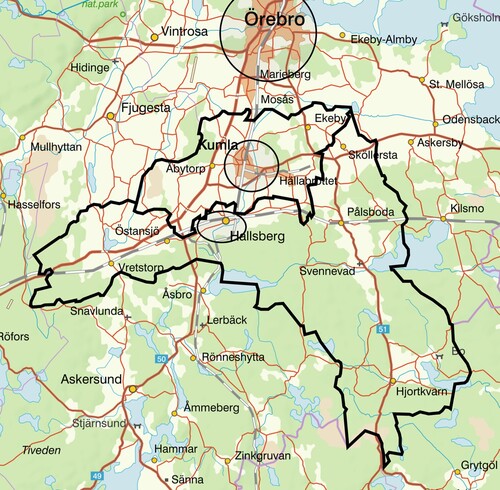
Figure 2. The geography of formal inter-municipal cooperation according to Hallsberg, to the left, and Kumla, to the right. A darker shading represents a greater amount of collaborations – from 1 to 7, White = 0. The thick black contour represents the geographical demarcation of Örebro County. Map source: SCB. Scale: 1 cm equals 26 km.
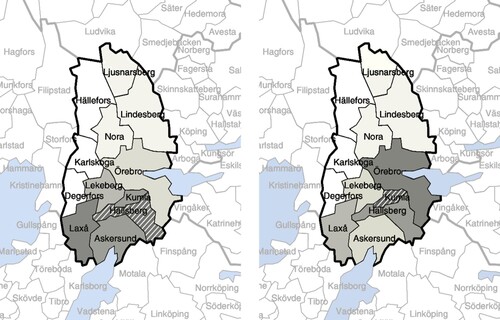
Figure 3. Map showing the towns of Kumla and Hallsberg, the municipal border (enhanced black line) and development sites: 1 – Brändåsen, 2 – Tälleleden/Ulvsätter, 3 – Rala, 4 – Kvarntorp. Map source: Lantmäteriets Geografiska SverigeData, översiktskarta 2020-01-24. Scale: 1 cm equals 1.5 km.
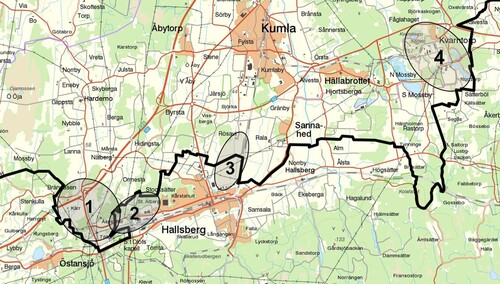
Figure 4. Map from the detailed plan ‘Norr om Tälleleden'. The tie-shaped area is surrounded by a red circle (upper left). The municipal border is enhanced with a dotted bold dark red line (Hallsbergs kommun Citation2014). Scale: 1 cm equals 120 m.
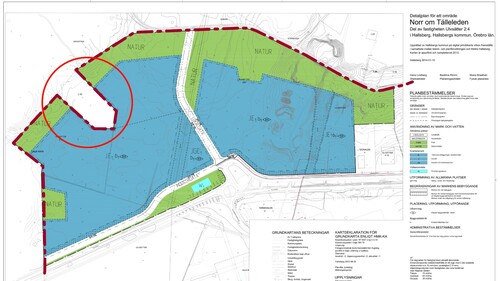
Figure 5. Illustration from the synchronized detailed plans for Rala industrial area, showing the distribution of the site in each municipality (Hallsbergs kommun Citation2012). The red line represents the municipal border. Scale: 1 cm equals 330 m.
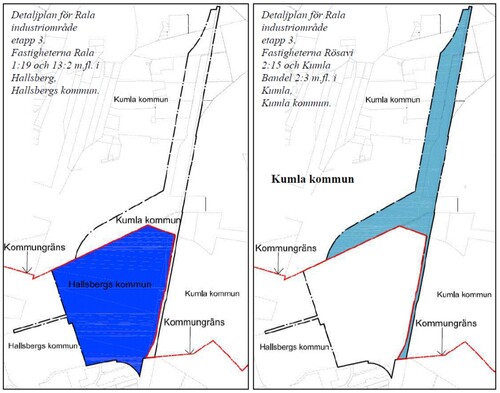
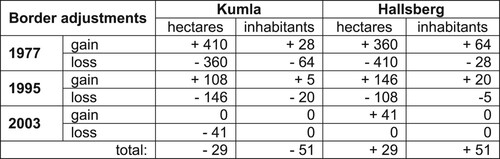
Figure 6 . The three most recent border adjustments and their consequences for area and population. Source: Kumla kommun (Citation2011c).