
Figures & data
Table 1. Study design and timeline for behavioral tests.
Figure 1. Effect of a short-term moderate reduction of dietary Mg intake (87% normal dietary Mg) on [Mg2+]CSF (a) and [Mg2+]RBC (b). (c) and (d) shows the effect on anxiety-like behavior as assessed by percent time spent in open arms and percent entries to open arms of the elevated plus maze. Unpaired t test, *p < 0.05, **p < 0.01. Data presented as mean ± SEM.
![Figure 1. Effect of a short-term moderate reduction of dietary Mg intake (87% normal dietary Mg) on [Mg2+]CSF (a) and [Mg2+]RBC (b). Figure 1(c) and (d) shows the effect on anxiety-like behavior as assessed by percent time spent in open arms and percent entries to open arms of the elevated plus maze. Unpaired t test, *p < 0.05, **p < 0.01. Data presented as mean ± SEM.](/cms/asset/6bc93ad6-98d4-4110-b86f-3beaf83f4a3e/ynns_a_1995119_f0001_ob.jpg)
Figure 2. [Mg2+]CSF for animals maintained on magnesium deficient diet (MgD) or control diet before (day 0) and after treatment (day 15) with various magnesium compounds. (a) significantly different from MgD + vehicle (p < 0.05); (b) significantly different from control diet (p < 0.05); (c) significantly different from day 0 (p < 0.02); (d) significantly different from day 0 (p < 0.02). n = 13–15 per group. Data presented as mean ± SEM.
![Figure 2. [Mg2+]CSF for animals maintained on magnesium deficient diet (MgD) or control diet before (day 0) and after treatment (day 15) with various magnesium compounds. (a) significantly different from MgD + vehicle (p < 0.05); (b) significantly different from control diet (p < 0.05); (c) significantly different from day 0 (p < 0.02); (d) significantly different from day 0 (p < 0.02). n = 13–15 per group. Data presented as mean ± SEM.](/cms/asset/f9ea0265-b11a-48dd-8a2a-e0d0b33a3057/ynns_a_1995119_f0002_ob.jpg)
Figure 3. Elevation of [Mg2+]CSF before (day 0) and after treatment (day 15) with different magnesium compounds. Data from were calculated and presented as a percentage of baseline level. *Significantly different from MgD + vehicle and control diet groups, p < 0.05. Data presented as mean ± SEM.
![Figure 3. Elevation of [Mg2+]CSF before (day 0) and after treatment (day 15) with different magnesium compounds. Data from Figure 2 were calculated and presented as a percentage of baseline level. *Significantly different from MgD + vehicle and control diet groups, p < 0.05. Data presented as mean ± SEM.](/cms/asset/8d12e460-e77d-4cec-abb8-bbadc29e4160/ynns_a_1995119_f0003_ob.jpg)
Figure 4. [Mg2+]RBC before (day 0) and after (day 15) treatment with different magnesium compounds. *Significantly different from baseline (day 0), p < 0.0001. n = 14–15 per group. Data presented as mean ± SEM.
![Figure 4. [Mg2+]RBC before (day 0) and after (day 15) treatment with different magnesium compounds. *Significantly different from baseline (day 0), p < 0.0001. n = 14–15 per group. Data presented as mean ± SEM.](/cms/asset/ccb973d9-e584-432f-8abd-cc558d849b35/ynns_a_1995119_f0004_ob.jpg)
Figure 5. Percent time spent in the open arms of the elevated plus maze before (day 0) and after (day 45) treatment with different magnesium compounds. *Significantly different from control diet group, p < 0.05. n = 14–15 per group. Data presented as mean ± SEM.
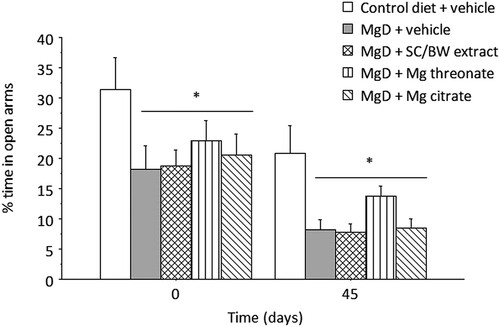
Figure 6. Percent entries into the open arms of the elevated plus maze before (day 0) and after (day 45) treatment with different magnesium compounds. *Significantly different from control diet group, p < 0.05. n = 14–15 per group. Data presented as mean ± SEM.
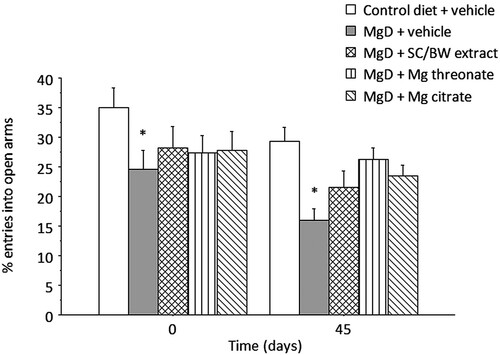
Figure 7. Recognition index (RI) in the novel object recognition (NOR) test before (day 0) and after (day 45) treatment with different magnesium compounds. *Significantly different from control diet group, p < 0.05. n = 15 per group. Data presented as mean ± SEM.
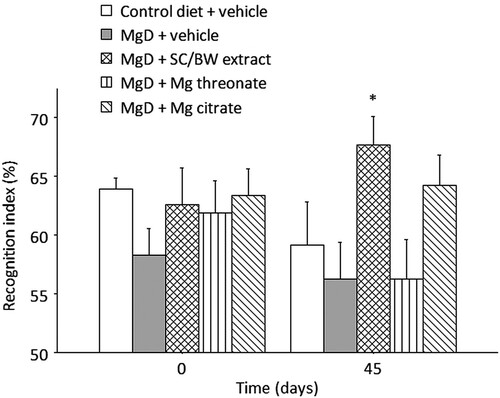
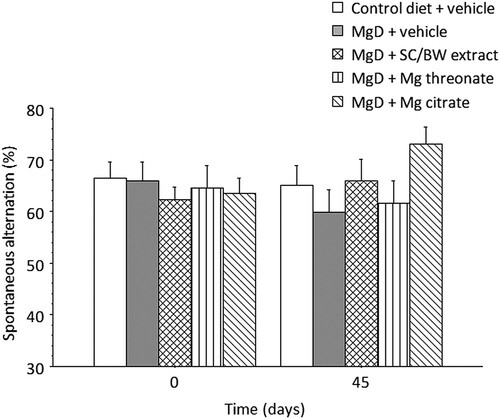
Figure 8. Spontaneous alternation (%) before (day 0) and after (day 45) treatment with different magnesium compounds. n = 14–15 per group. Data presented as mean ± SEM.
Data availability statement
The data that support the findings of this study are available from the corresponding author, B.F.E.-K., upon reasonable request.