
Figures & data
Figure 1. The reported number of ATCs in the three groups: Typical development, Disability group, and Habilitation group. *** = p < .001.
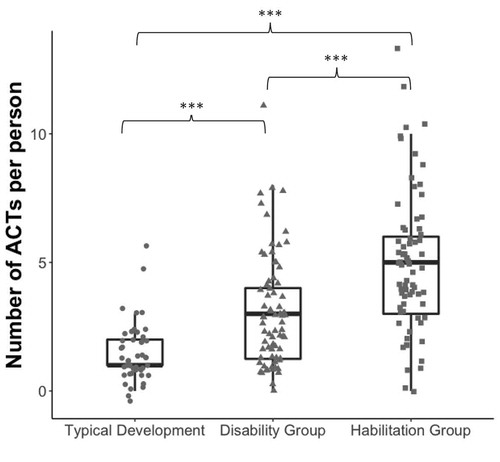
Table 1. Mean and SD reported ATC per respondent divided on each group.
Table 2. The definition of the themes from the thematic analysis.
Supplemental material