Figures & data
Figure 1. A schematic diagram of the peripheral and central taste processing pathways.
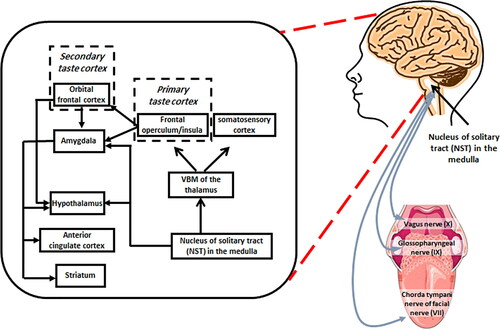
Figure 2. Schematic diagram illustrating signaling pathway of umami taste transduction.
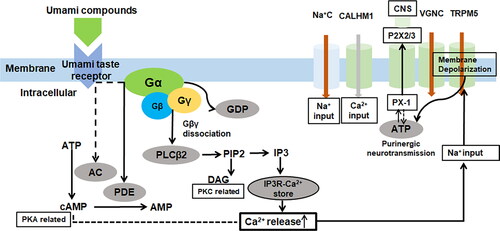
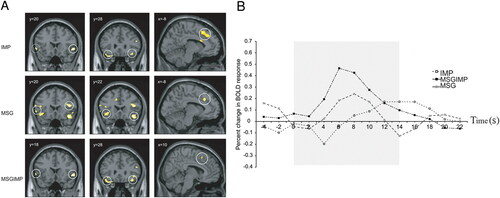
Figure 3. (A) Cortical activation maps produced by inosine 5’-monophosphate (IMP), monosodium glutamate (MSG), and a combination of the MSG and IMP (MSGIMP) in the insula/operculum area, the orbitofrontal cortex (OFC), and the anterior cingulate cortex. (B) Timecourses of cortical activation to IMP, MSG, and MSGIMP in the OFC showing the supra-additivity effects of the combination of the MSG and IMP. Figures modified from De Araujo et al. (Citation2003) (De Araujo, Kringelbach, Rolls, and Hobden Citation2003) and reproduced with authors permission.