
Figures & data
Figure 1. Acres cultivated for bluberries, blackberries and chokeberries (Aronia) in the United States. Source: USDA, National Agricultural Statistics Service (2021).
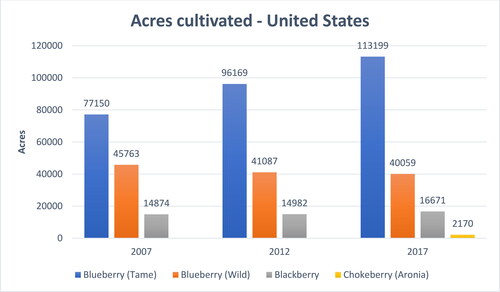
Figure 2. Nutrient composition of blueberries in (wetbasis, wb %) (FoodData Central Citation2021).
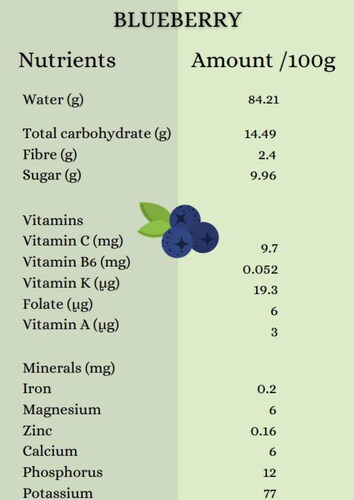
Figure 3. Nutrient composition of blackberries in (wetbasis, wb %) (FoodData Central Citation2021).
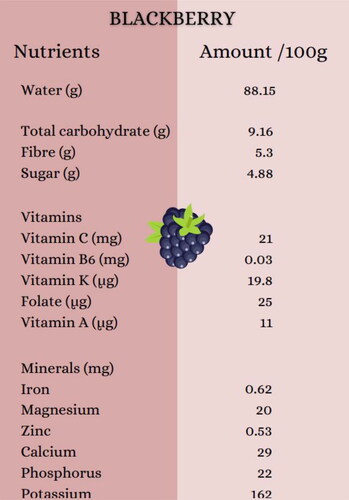
Figure 4. Nutrient composition of chokeberries in (wetbasis, wb %) (Karakashova et al. Citation2016; Kulling and Rawel Citation2008).
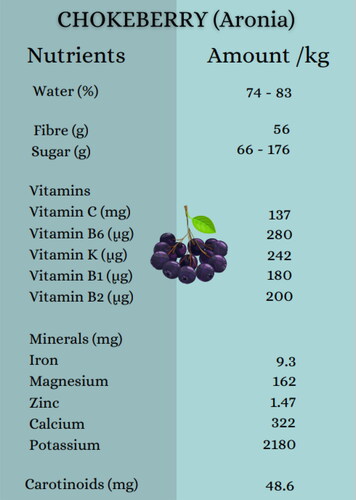
Figure 5. Schematic diagram of a direct solar drying. Adapted from (Prakash and Kumar Citation2013).
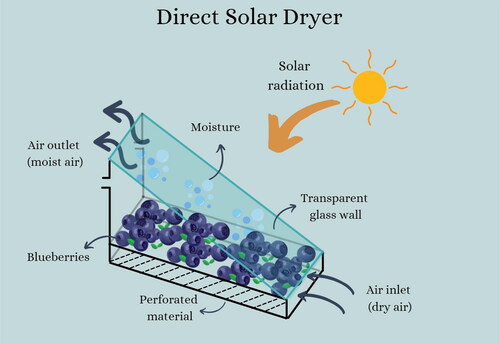
Figure 6. Schematic diagram of Conventional Air Drying – Oven drying. Adapted from (Kassem et al. Citation2011).
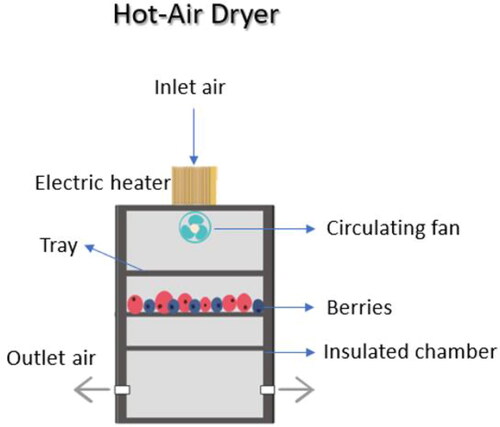
Figure 7. Effect of oven drying (at different temperature and time) on total phenolics, anthocyanin content and anti-oxidant capacity (indicated in the secondary vertical label) in chokeberries. Fresh sample contents are also shown for comparison. Data (Samoticha, Wojdyło, and Lech Citation2016).
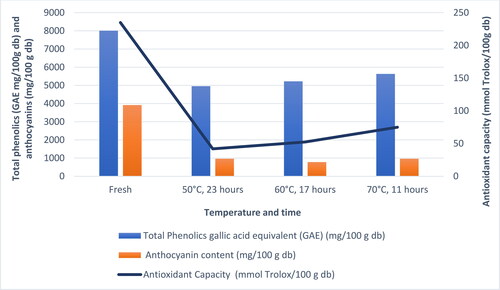
Figure 8. Comparison of oven and freeze drying on vitamin C retention of berries (Chokeberry- Aronia; Blueberry & Blackberry).
Date from: Nemzer et al. (Citation2018) and Sadowska, Jadwiga, and Klóska (Citation2017).
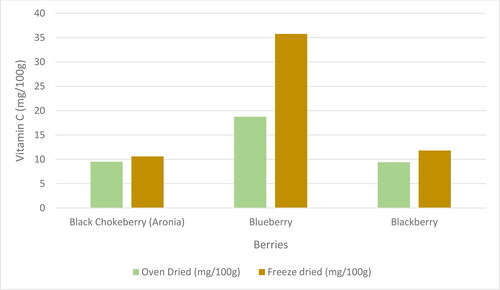
Figure 9. (a) Schematic diagram of a freeze dryer. (b) Freeze drying process of blueberries.
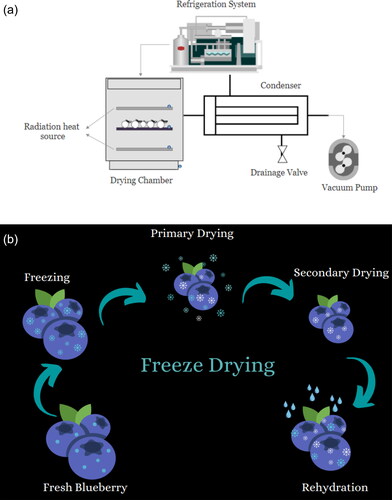
Table 1. Application of freeze drying for blueberries, blackberries and chokeberries (Aronia).
Table 2. Impact of drying on optical properties and rehydration potential of blueberries, blackberries and chokeberries (Aronia).
Figure 10. Schematic diagram of a spray dryer.
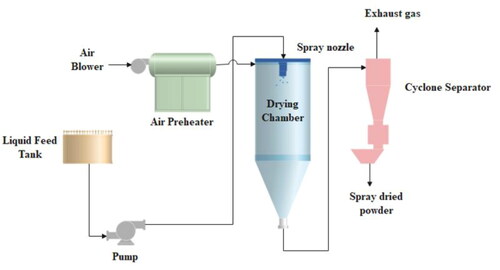
Figure 11. Mechanism of spray drying.
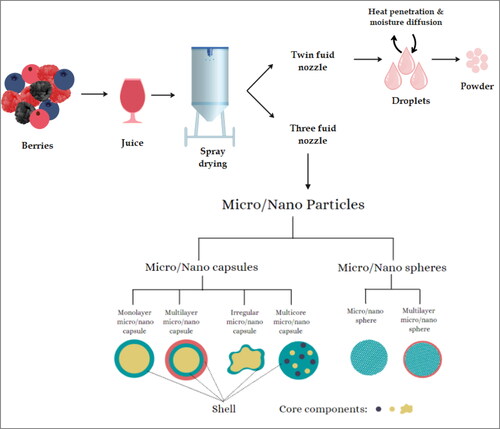
Figure 12. Influence of spray drying operating conditions on powder characteristics. Data from: (Phisut Citation2012; Shishir and Chen Citation2017).

Table 3. Application of different carrier material for spray drying of blueberries, blackberries and chokeberries (Aronia).
Figure 13. Classification of thin – layer modeling.
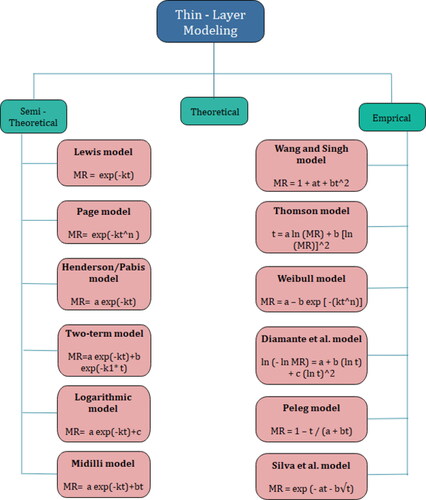
Figure 14. Drying curve.
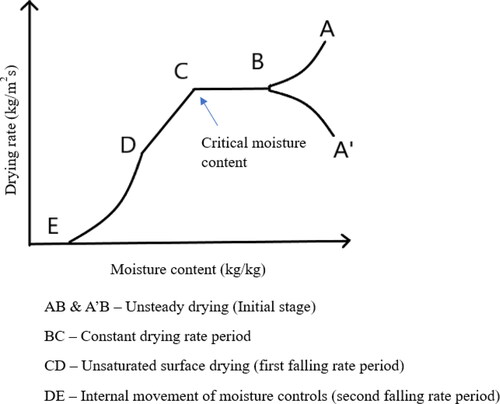
Table 4. Recent applications of thin layer models to describe the drying kinetics for blueberries, blackberries and chokeberries (Aronia).
Table 5. Degradation kinetics of vitamins and anthocyanins in blueberries and blackberries during drying.