
Figures & data
Figure 1. Flowchart of study selection.
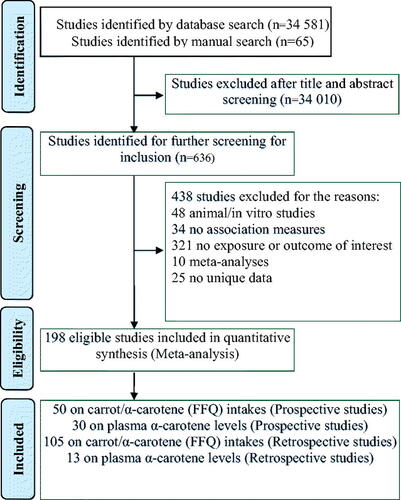
Table 1. Summary of the individual dietary intakes and cancer risk.
Figure 2. Analysis of highest compared to lowest carrot/α-carotene intake and cancer risk in 50 prospective studies. The squares represent the RR for each study and the horizontal lines are the 95% confidence interval around this estimate. The area of each square is proportional to its weighting in the meta-analysis. The diamond is the pooled estimate, with 95% CI. Circles indicate studies at risk of contribution to publication bias, see .
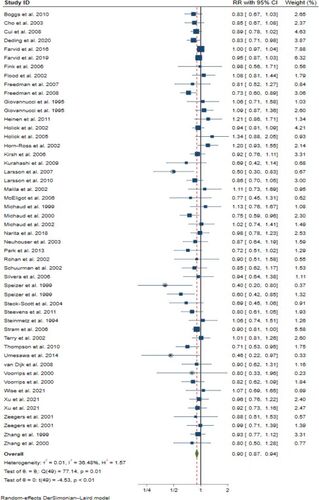
Table 2. Subgroup analyses of association between carrot/α-carotene intake and risk of cancers in 50 prospective studies.
Figure 3. Egger’s funnel plot for publication bias in the meta-analysis of 50 prospective studies on carrot/α-carotene intake, p = 0·047 with egger’s test. Testing only the 46 studies shown as diamonds gives p = 0·294. The studies shown as squares rather than diamonds are marked with a circle in .
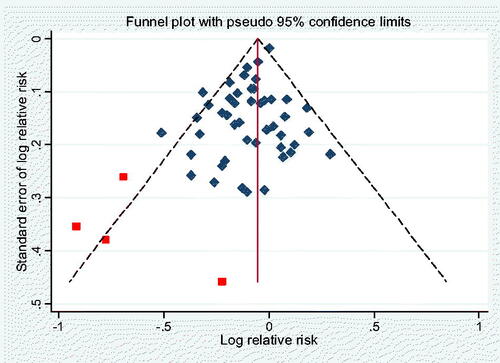
Figure 4. Analysis of highest compared to lowest plasma α-carotene levels and cancer risk in 30 prospective studies. The squares represent the RR for each study and the horizontal lines are the 95% confidence interval around this estimate. The area of each square is proportional to its weighting in the meta-analysis. The diamond is the pooled estimate, with 95% CI.
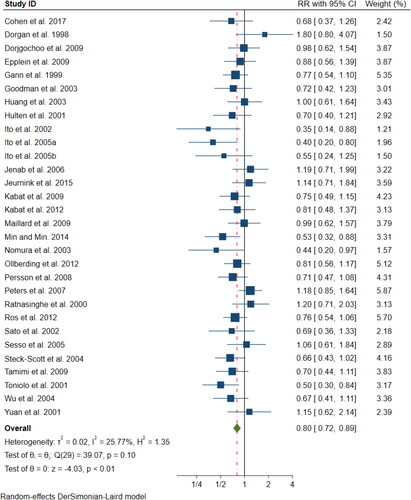
Figure 5. Egger’s funnel plot for publication bias in the meta-analysis of 30 prospective studies on plasma α-carotene levels (p = 0·114).
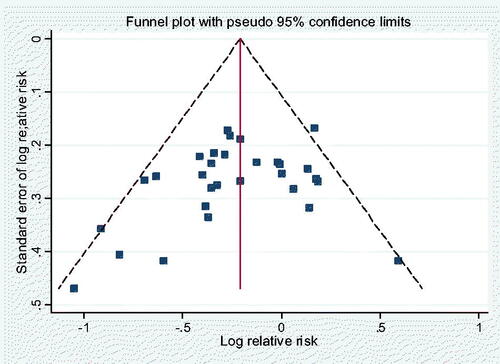
Table 3. Subgroup results for plasma α-carotene levels and cancer risks in 30 prospective studies.
Figure 6. A, B. Dose–response analyses with estimated RRs for cancer risks by doses of carrot (open circles)/α-carotene (hatched circles) intake in 33 studies (a), and plasma α-carotene in 17 studies (B). the solid line represents the estimated relative risks, and the dotted lines the 95% confidence intervals. The diameter of each data point is proportional to the weight of the corresponding data point in the analysis.
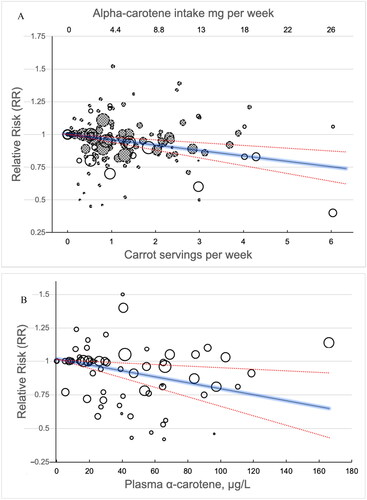
Table 4. Estimated RRs from linear dose-response relationships in prospective studies.
Supplemental Material
Download MS Word (1.7 MB)Data availability statement
The included studies are tabulated in the Supplementary Information (Tables S1–S6) as well as additional analyses, while the full datasets are deposited at Newcastle University’s data repository https://data.ncl.ac.uk/ with the DOI: 10.25405/data.ncl.21931533 (Ojobor et al. Citation2023).