Figures & data
Figure 1. In vitro gene editing experimental approach and confirmation. (A) Cas12a RNP is complexed and added to the first in vitro cleavage reaction mixture with plasmid DNA. Plasmid DNA is recovered and added to a second in vitro re-circularizing reaction mixture with cell-free extract. After the reaction is complete, plasmid DNA is recovered from the reaction and transformed into competent E. coli. DNA is then isolated from transformed cells and sequenced to identify modifications made in vitro. Modified from Sansbury et al. [Citation16] (B) FLT3-ITD sequences, designated Patient 4 37 bp ITD (P4) and the Patient 5 76 bp ITD (P5) respectively were previously identified in pediatric AML patients [Citation53] (C) FLT3 expression plasmid template was used in the in vitro gene editing reaction to produce FLT3 mutant plasmids that express FLT3 ITD mutations, ITDs, point mutations or different combination of both. (D) FLT3 mutation molecular description. (E) 1x10⁶ cells that showed IL-3 depletion survival were cultured for 9 days in the presence of puromycin to further confirm the FLT3 cassette stable integration. Top graph was used as control to show the sensitivity of un-transfected Baf/3 cells to puromycin in the presence or absence of IL-3.
![Figure 1. In vitro gene editing experimental approach and confirmation. (A) Cas12a RNP is complexed and added to the first in vitro cleavage reaction mixture with plasmid DNA. Plasmid DNA is recovered and added to a second in vitro re-circularizing reaction mixture with cell-free extract. After the reaction is complete, plasmid DNA is recovered from the reaction and transformed into competent E. coli. DNA is then isolated from transformed cells and sequenced to identify modifications made in vitro. Modified from Sansbury et al. [Citation16] (B) FLT3-ITD sequences, designated Patient 4 37 bp ITD (P4) and the Patient 5 76 bp ITD (P5) respectively were previously identified in pediatric AML patients [Citation53] (C) FLT3 expression plasmid template was used in the in vitro gene editing reaction to produce FLT3 mutant plasmids that express FLT3 ITD mutations, ITDs, point mutations or different combination of both. (D) FLT3 mutation molecular description. (E) 1x10⁶ cells that showed IL-3 depletion survival were cultured for 9 days in the presence of puromycin to further confirm the FLT3 cassette stable integration. Top graph was used as control to show the sensitivity of un-transfected Baf/3 cells to puromycin in the presence or absence of IL-3.](/cms/asset/9c442d72-ea6e-466f-b494-7862ec1cfa65/ilal_a_1805740_f0001_c.jpg)
Figure 2. Baf/3 cell transformation by FLT3 Expression. 4 × 10⁵ Baf/3 cells were transfected with 2ug of plasmid DNA by Nucleofection using the 4 D-Nucleofector SG Cell Line X Kit and CM-147 program. Cells were incubated for 72 h post transfection in IL-3 supplemented media. At this time 2 x10⁵ cells were plated into a 6-well plate containing IL-3 supplemented media. At 4 days cells were counted and plated into media lacking IL-3 to select for transformed cells. Cell count was performed by trypan blue exclusion.
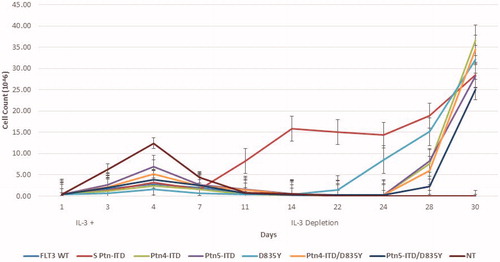
Figure 3. Localization of FLT3. Immunofluorescence staining of Baf/3 FLT3 expressing cells and un-transfected cells. Scale bars represent 20 µm and 15 µm.
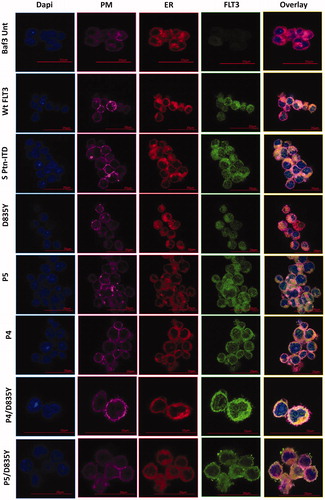
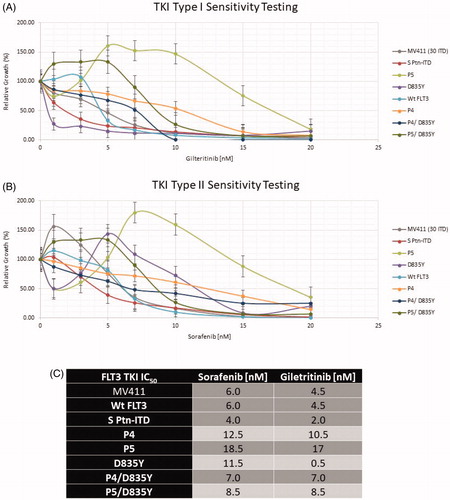
Figure 4. FLT3 mutation drug sensitivity assay. (A) Gilteritinib and (B) Sorafenib. Relative cell growth of Ba/f3 cells expressing the indicated FLT3 mutants after 72 hr treatment with increasing concentrations of Sorafenib or Gilteritinib. Errors bars represent the Standard Error (n = 4). (C) FLT3 TKI IC50.