
Figures & data
Table 1. The chapters in the OpenSciEd design specifications (OpenSciEd, Citation2018a)
Figure 1. A page from an OpenSciEd teacher guide, showing callouts on the right

Figure 2. The issues addressed in the OpenSciEd design framework
Figure 3. A representation of the OpenSciEd scope and sequence
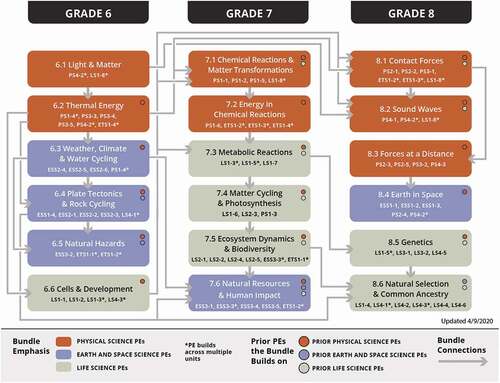
Table 2. Teachers’ reports of frequency of activities by students across six units. Teachers selected one of the following for each unit: 0 = In no lessons, 1 = In a few lessons, 2 = in half the lessons, 3 = in most lessons, 4 = in nearly every lesson
Figure 4. Results from a student interest survey for a unit on natural resources, showing results disaggregated by race and ethnicity
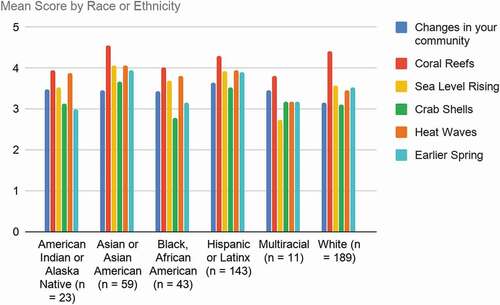
Figure 5. Students’ ratings of relevance aggregated across all units and all lessons from the field tests of the first six units developed
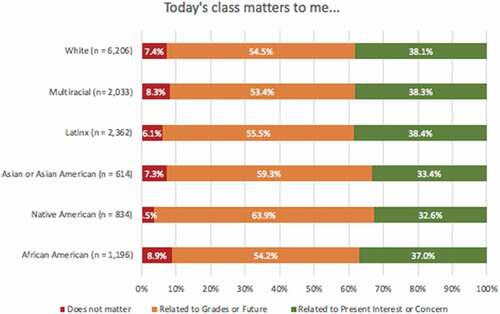
Figure 6. Students’ reports of whether they contributed an idea to a discussion and if they thought their contribution(s) influenced others on the day they were surveyed. This chart shows all responses from all students across all surveys from the six units that have been field tested at the time of writing
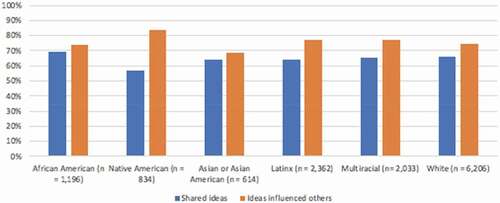
Table 3. The category of participants engaged in each of the design and development activities