Figures & data
Table 1. Confidence Interval Estimation Facts (Based on 1996 Data)
Figure 1. Student Intervals for Phase
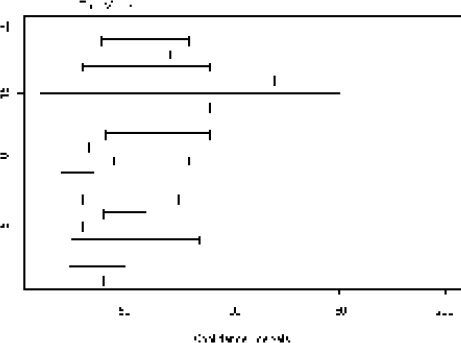
Figure 2. Computer-Generated 95% Confidence Intervals for the Mean of a Normal Distribution, n = 10.
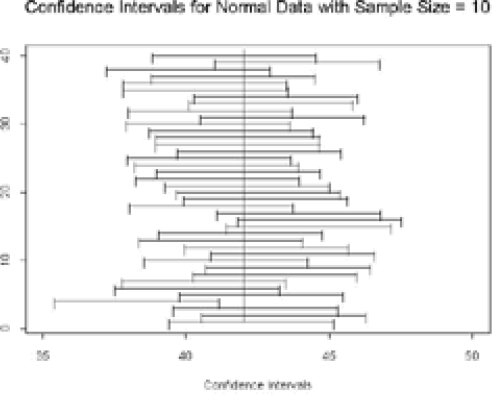
Figure 3. Computer-Generated 95% Confidence Intervals for the Mean of a Normal Distribution, n = 20.
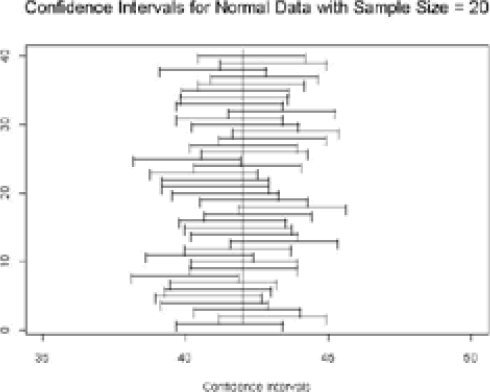
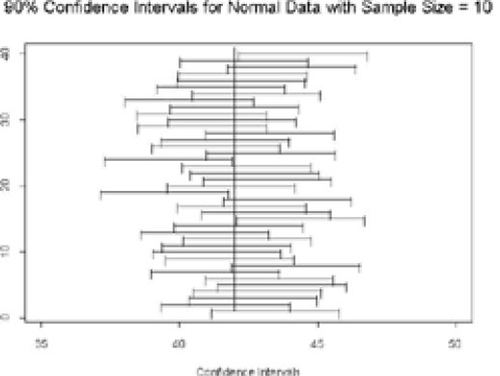
Figure 4. Computer-Generated 90% Confidence Intervals for the Mean of a Normal Distribution, n = 10.