Figures & data
Figure 1. (A) The size distribution of HN/CDDP/OA. (B) The morphology of CC/CDDP/OA and HN/CDDP/OA nanoparticles using TEM. Scale bar: 100 nm. (C) The comparative AT1R and CXCR4 proteins in HN/CDDP/OA and bare CM.
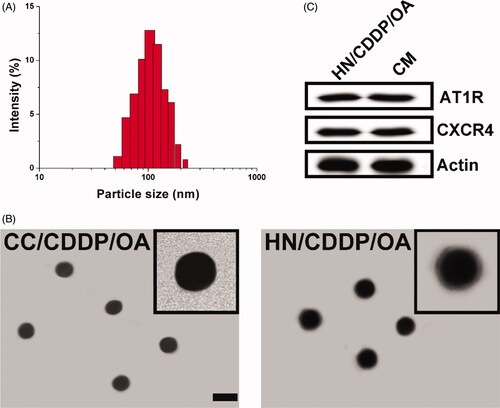
Figure 2. (A) The time-dependent size changes of HN/CDDP/OA in PBS and plasma for 48 h. (B) The concentration-dependent hemolysis of HN/CDDP/OA against 2% RBC. Data were repeated thrice and expressed as standard deviation.
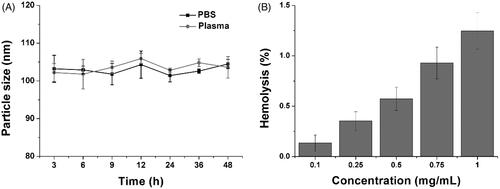
Figure 3. The drug release of CDDP and OA from HN/CDDP/OA at pH of 7.4 (A) and 5.5. Data were repeated thrice and expressed as standard deviation.
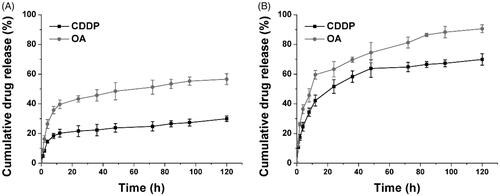
Figure 4. The cell viability revealed by MTT assay after MGC-803 cells treated with HN/CDDP or HN/OA at different CDDP (A) or OA (B) concentrations for 48 and 72 h. (C) The CI of HN/CDDP/OA treated MGC-803 cells for 72 h at different CDDP/OA ratios (w/w). (D) The in vitro anticancer effect of HN/CDDP/OA (CDDP:OA = 10, w/w) at different drug concentrations. Data were repeated thrice and expressed as standard deviation.
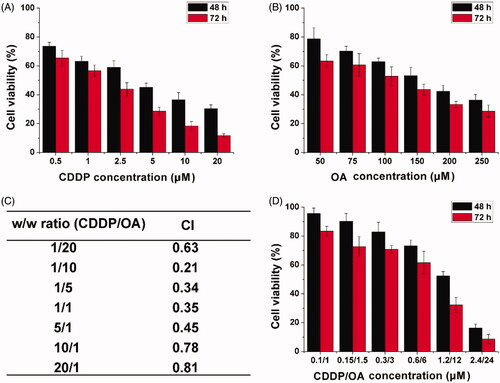
Figure 5. The volume variations (A) and optical images of MS treated with different formulations. Data were repeated thrice and expressed as standard deviation.
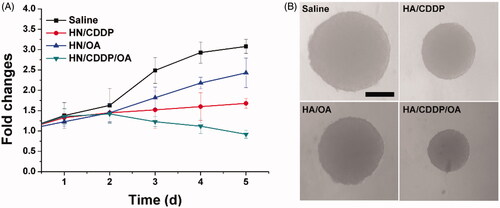
Figure 6. (A) The apoptosis of MGC-803 cells treated with different formulations at the drug concentration of 0.89/8.9 μM for 72 h. (B) The cell cycle variations of MGC-803 cells treated with HN/CDDP/OA for different time intervals. Data were repeated thrice and expressed as standard deviation.
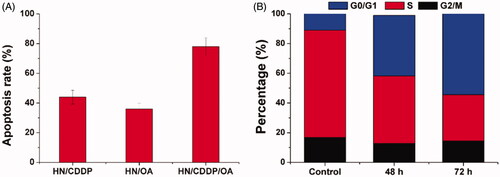
Figure 7. (A) The intracellular drug concentration of MGC-803 cells treated with different formulations for different time intervals. Data were repeated thrice and expressed as standard deviation. (B) The western blot assay of protein variations after MGC-803 cells treated with different formulations for 72 h.
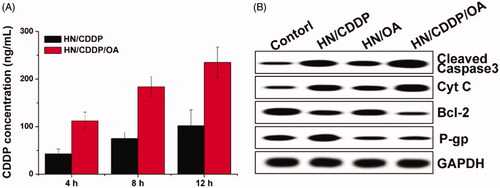
Figure 8. The in vitro (A) and in vivo (B) targeting assays of HN/CDDP/OA. Data were repeated thrice and expressed as standard deviation.
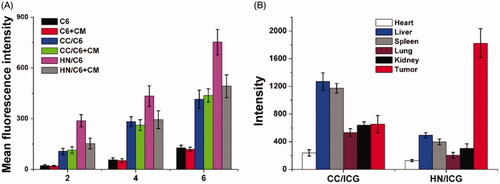
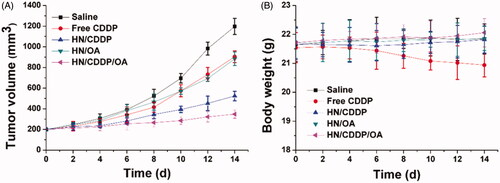
Figure 9. The tumor volume (A) and body weight (B) variations of MGC-803 tumor-bearing mice treated with different formulations. Data were repeated thrice and expressed as standard deviation.