Figures & data
Table 1. Summary of nanoparticles as drug delivery systems.
Figure 1. Schematic representation of chitosan-phospholipid interaction and the self-assembly of SACPNs.
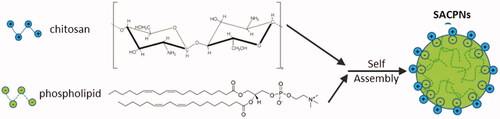
Figure 2. Schematic illustration of the preparation of SACPNs by the classic solvent injection method.
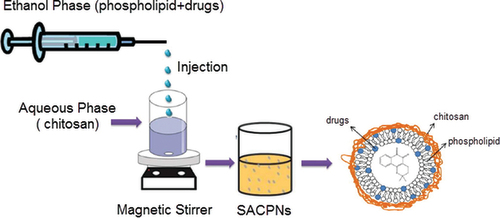
Figure 3. (a) Schematic illustration of quercetin-loaded SACPNs. (b) TEM images of quercetin-loaded SACPNs. (c) Visual observation of crude quercetin in water (left) and quercetin-loaded SACPNs suspension (right). (a, b, c) Reproduced with permission (Tan et al., Citation2011). Copyright 2011, Informa PLC.
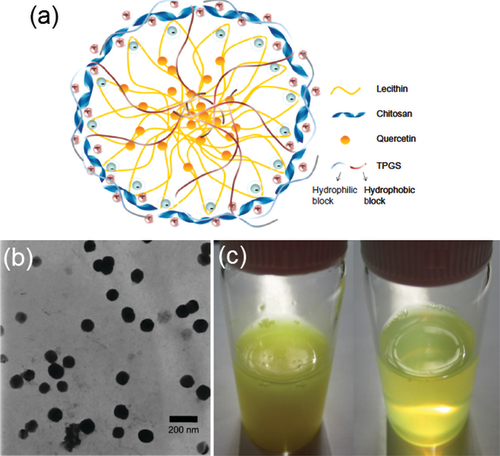
Figure 4. (a) Transmission electron micrographs of SACPNs. (b) Atomic force microscopy images of SACPNs. (c) FTIR spectra of SACPNs and of the two components separately. (d) Comparison of the mean square hydrogen fluctuation differences of a dry SACPNs (open triangles) and a pure phospholipid one (closed triangles). (e) FTIR spectra of (e1) chitosan, (e2) phospholipid, (e3) natamycin and (e4) natamycin-loaded SACPNs. (a, b, c) Reproduced with permission (Sonvico et al., Citation2006). Copyright 2006, Elsevier. (d) Reproduced with permission (Sonvico et al., Citation2006). Copyright 2006, Elsevier. (e) Reproduced with permission (Bhatta et al., Citation2012). Copyright 2012, Elsevier.
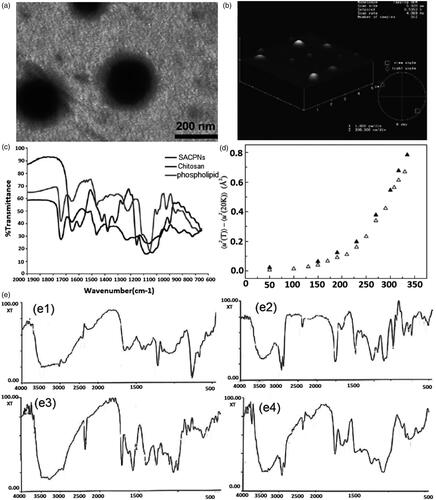
Figure 5. (a) Schematic illustrations of the mesoscopic models of SACPNs. The yellow spheres represent the hydrophobic part of the phospholipid, while the red spheres represent the hydrophilic part. The chitosan are assembled in a random configuration around the phospholipid. (b) Distribution of chitosan on the xy plane. (b1) 50 chains of chitosan; (b2) 100 chains of chitosan; (b3) 150 chains of chitosan; (b4) 200 chains of chitosan. (c) Cryo-TEM image of SACPNs containing tamoxifen (c1) and progesterone (c2). (a, b) Reproduced with permission (Terrón-Mejía et al., Citation2018). Copyright 2018, MDPI. (c) Reproduced with permission (Gerelli et al., Citation2008). Copyright 2007, IOP Publishing.
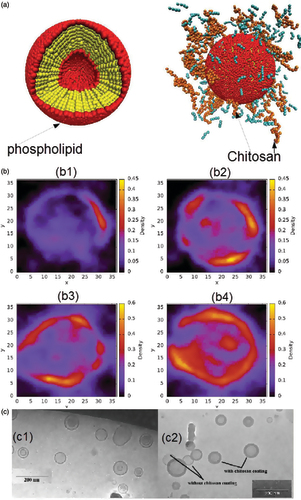
Figure 6. Schematic illustrations of drug release mechanisms of SACPNs.
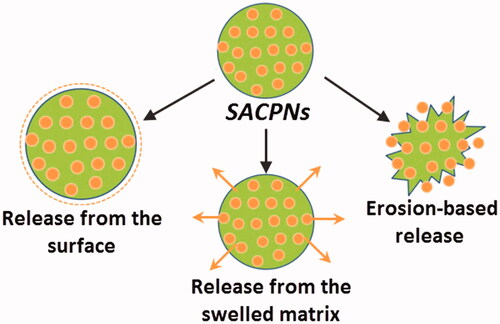
Table 2. Summary of recent studies of SACPNs as drug delivery systems.
Figure 7. (a, b) SEM images of the clobetasol propionate-loaded SACPNs at 80 Kx (a) and 500 Kx (b) magnifications. (c) Histology of the rat skin samples: (c1) control; (c2) commercial cream; (c3) SACPNs; (c4) Na-DOC gel. (d) Amount of DFV accumulated from formulations in the SC + epidermis (dark bars) and dermis (light bars). (e) Changes in the paw thickness of the rats with respect to time after formulation applications. (a, b, c) Reproduced with permission (Şenyiğit et al., Citation2016). Copyright 2017, MDPI. (d, e) Reproduced with permission (Özcan et al., Citation2013). Copyright 2013, Dove Press.
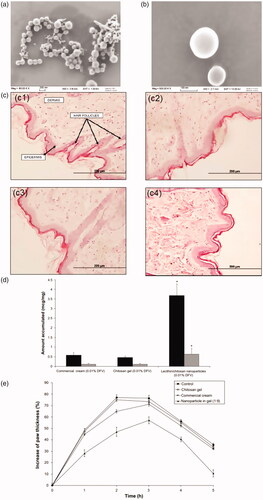
Figure 8. (a) Simvastatin release profile from simvastatin-loaded SACPNs (filled circle) and a control simvastatin suspension (open circle) in simulated nasal fluid (b) Radioactivity biodistribution in rats 90 minutes after the nasal instillation of 20 μL (10 μL in each nostril) of 99 mTc-labeled simvastatin-loaded SACPNs, simvastatin suspension, and pertechnetate (TcO4–) (a, b) Reproduced with permission (Clementino et al., Citation2016). Copyright 2016, Dove Press.
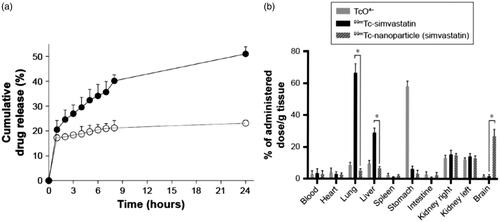
Figure 9. (a, b) Zone of inhibition of amphotericin-B, Fungizone and amphotericin-B-laded SACPNs against A. fumigates. (c) Bar graphs represent zone of inhibition of different formulations against A. fumigates. (d) Cular pharmacokinetic profile of amphotericin-B following topical instillation in rabbit eyes. (a, b, c, d) Reproduced with permission (Chhonker et al., Citation2015). Copyright 2015, Elsevier.
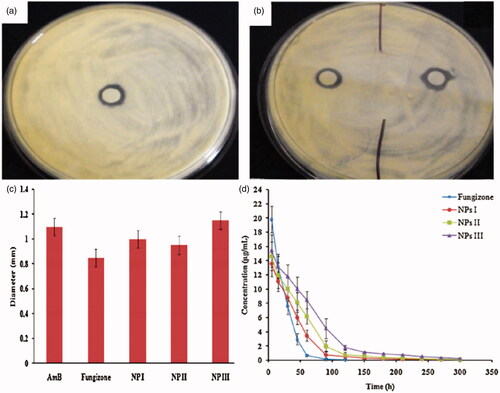
Figure 10. (a) In vitro time-dependent release profiles of insulin-loaded SACPNs with different phospholipid/chitosan ratios. (b) Time-dependent reduction in blood glucose levels in diabetic rats. (a, b) Reproduced with permission (Liu et al., Citation2016). Copyright 2016, Dove Press.
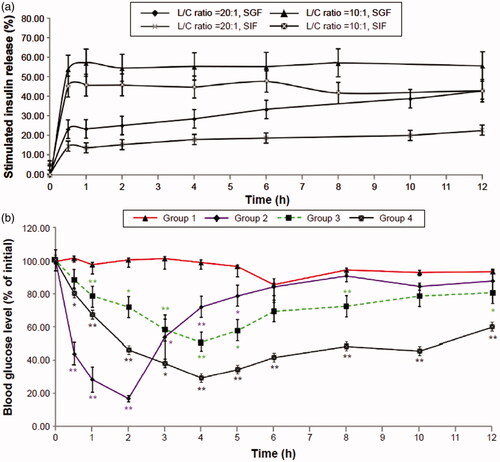
Figure 11. (a) Morphological characterization of curcumin-loaded SACPNs by TEM (left) and SEM (right). (b) The inhibition of Nitric oxide activity (left) and H2O2 activity (right) in blank nanoparticles (Blank), curcumin powder (CP) and curcumin-loaded SACPNs. (a, b) Reproduced with permission (Pathak et al., Citation2015). Copyright 2015, Springer Nature.
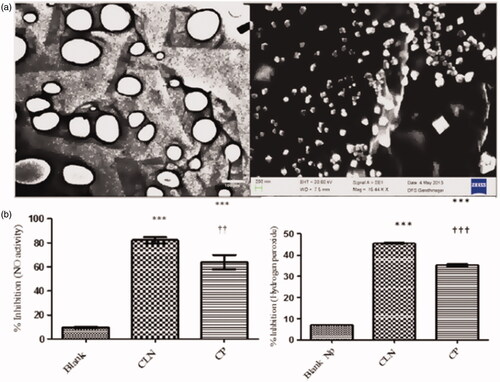
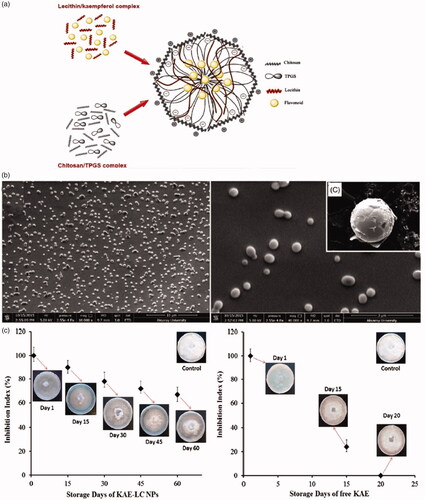
Figure 12. (a) Schematic illustration of KAE-SACPNs. (b) Morphology and dispersivity of KAE-SACPNs. (c) Effect of KAE-SACPNs and pure KAE on the radial growth of Fusarium oxysporium in time dependent manner. (a, b, c) Reproduced with permission (Ilk et al., Citation2017). Copyright 2016, Taylor & Francis Group.