Figures & data
Figure 1. Gene transfection and apoptosis of OCSCs by ultrasound combined with PSP@MB delivery of ALDH1 shRNA. (A) Fluorescent images of OCSC exposed to plasmid-containing encoded ALDH1 shRNA of different reagents: (a) Control group, (b) Lipofectamine 2000 group, (c) US + PSP@MB group. The ultrasound parameters were (0.8 W/cm2, 1 MHz, 20% duty cycle, 30 s), (scale bar = 100 μm). (B) Transfection efficiency rate was evaluated by flow cytometry and represented as histograms. The transfection efficiency rate was 18.41% in the US + PSP@MB group, higher than Lipofectamine 2000 group (14.62%). (C) Apoptosis rate was evaluated by flow cytometry and represented as histograms. The apoptosis rate was 32.62% in the US + PSP@MB group, higher than Lipofectamine 2000 group (25.5%).
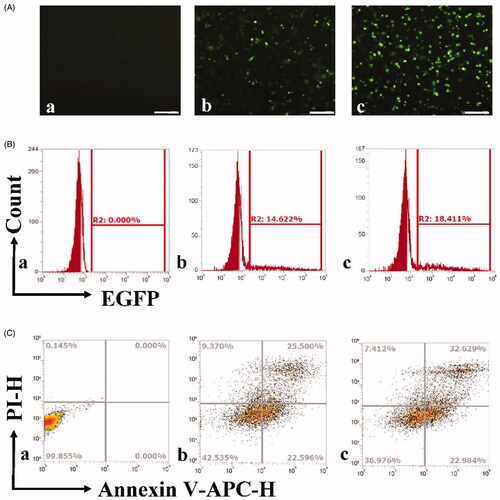
Figure 2. Characteristics of the PSP, MB, and PSP@MB. (A) The average diameters of the PSP NPs were approximately 100 nm with the dynamic light scattering (DLS) measurement. To evaluate the reduction sensitivity of PSP NPs, after the incubation with 10 mM GSH for 2 h, the average diameters of the PSP NPs were 210 ± 101 nm. (B) The zeta potential of PSP NPs was 4 ± 2.5 mV due to the PEGylation, and after GSH treatment the zeta potential of PSP NPs was 12 ± 4.3 mV due to the dePEGylation (p < .05). (C) The successful dePEGylation of PSP with GSH treatment confirmed by 1H NMR spectra in D2O. In the presence of GSH, the disulfide bond was cleaved, accompanying with the shift of chemical shift from 2.68–2.94 to 2.45 ppm. (D) The successful dePEGylation of PSP with GSH treatment was verified by Fourier transform infrared (FT-IR). (E) FITC-streptavidin was conjugated with MB. Successful connection of PSP NPs loaded MBs was confirmed by fluorescence microscope. Transmission electron microscope (TEM) images of MB (F) and PSP@MB (G) showed the similar particle size with DLS. (I) The DLS measurement showed that the average diameters of the MBs and PSP@MB were approximately 495 ± 132 nm and 502 ± 75 nm, and (K) zeta potential were 7 ± 3.6 mV and 13 ± 4.4 mV (p < .05). (J) To confirm the pDNA binding ability of PSP NPs, we checked the retardation of pDNA mobility in agarose-gel electrophoresis. The pDNA condensation ability of PSP NPs was tested with various N/P ratios (0, 8, 10, 11, 12, 14, and 16). PSP showed beneficial complexation of pDNA. When the N/P ratio is 16, no free DNA could be observed on the gel, which indicated that the PSP can condense the pDNA entirely. However, the optimized concentration proportion between PSP@MB and pDNA is more important for gene transfection.
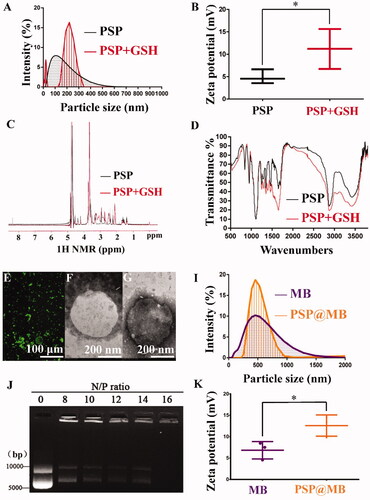
Figure 3. OCSCs spheroids were obtained with ALDEFLUOR assay and FACS. (A) The microscope image of irregular spheroids derived with the A2780 cells with serum free culture for three weeks. (B) The spheroids were sorted with FACS analyses of ALDH activity with ALDEFLOUR staining in the presence or absence 5 μL of diethylaminobenzaldehyde (DEAB) reagent, which was the ALDH1 inhibitor. The ALDH1+ (54.8%) was sorted by flow cytometry compared with Control groups (1.07%) (p< .01). After sorting, the ALDH1+ OCSCs and ALDH1– A2780 cells were cultured with serum-free culture. (C) One month later, ALDH1+ OCSC spheroids were full and globular. (D) The ALDH1+ OCSC spheroids changed into monolayers with serum culture medium for 48 h (scale bar = 100 μm). (E, F) Compared with ALDH1– A2780 cells, the ALDH1+ OCSC spheroids had higher tumorigenesis abilities in vivo (p< .01).
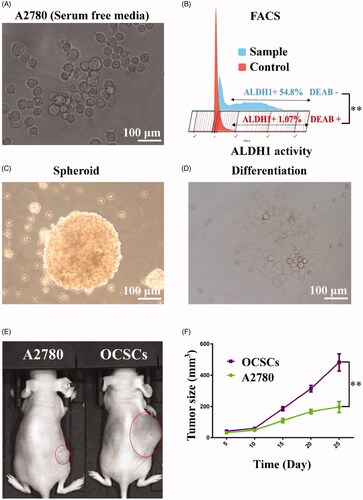
Figure 4. Spatiotemporal characteristics of sonoporation and resealing of OCSCs. (A) OCSCs were sonicated with ultrasound combined with PSP@MB. The ultrasonic parameters were 0.8 W/cm2, 20%, 1 min, 1 MHz. There were six groups: (a) Control group, (b) PSP@MB group, (c) US0 group, (d) US + PSP@MB0 group, (e) US + PSP@MB30 group, and (f) US + PSP@MB60 group. The time-varying pore morphology and resealing of the OCSCs membrane were determined by scanning electron microscopy (SEM). The numbers of pores were characterized as decreasing with a half-life close to 30 min and 60 min after sonoporation. Most OCSCs showed full recovery of their native membrane integrity. (B) Representative confocal microscopy images of Calcein (green) and PI (red) in OCSCs 30 min after sonication. (a) Control group, (b) PSP@MB group, (c) US group, (d) US + PSP@MB group, (e) enlarged figure from Control group, and (f) enlarged figure from US + PSP@MB group. The green arrow indicates live cells and the red arrow indicates dead cells. The yellow arrow exhibits that co-localization of Calcein and PI inside cells due to the sonoporation generated by ultrasound combined PSP@MB.
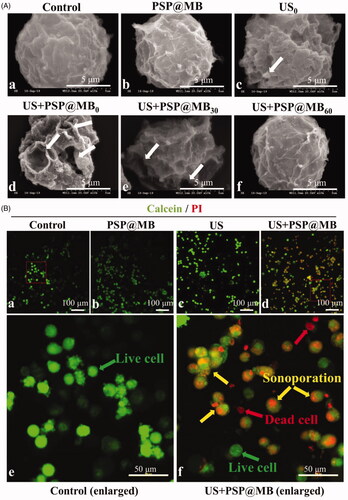
Figure 5. Enhancing endocytosis of gene by ultrasound and PSP@MB. Ultrasound combined with PSP@MB to promote OCSCs endocytosis of CY5-pDNA. There were four groups: Control group, PSP@MB group, US group, and US + PSP@MB group. US + PSP@MB group for 1 h and 4 h was enlarged. CLSM images of OCSCs transfected with PSP@MB combined ultrasound for 10 min, 1 h, 4 h, and 24 h. There were more CY5-pDNA (red) in OCSCs in the PSP@MB + US group compared to PSP@MB group or P(CY5-pDNA) group. It showed that PSP@MB + US could efficiently deliver pDNA to OCSCs with enhancing endocytosis. The time of higher intracellular pDNA was 1–4 h.
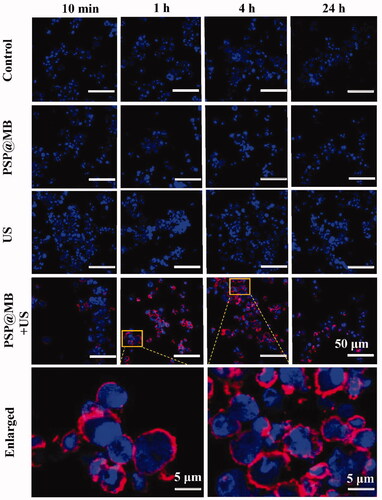
Figure 6. Ultrasound combined with PSP@MB to promote endocytosis of 155 kDa FITC-dextran into A2780 cells. (A) Fluorescent images of 155 kDa FITC-dextran into A2780 exposed via ultrasound and PSP@MB. The experimental groups were: (a) Control group, (b) PSP@MB group, (c) US group, (d) US + PSP@MB 0.2 W/cm2 group, (e) US + PSP@MB 0.4 W/cm2 group, (f) US + PSP@MB 0.6 W/cm2 group, (g) US + PSP@MB 0.8 W/cm2 group, and (h) US + PSP@MB 1.0 W/cm2 group. The ultrasonic parameters were (1 MHz, 20% duty cycle, 1 min). (B) Fluorescence intensity was represented as histograms. Fluorescence intensity increased following the acoustic intensity increase. The relative fluorescence intensity was (16.87 ± 2.73) in the (h) group, higher than (e) group (7.53 ± 1.42) and (f) group (13.22 ± 1.85). Compared with the relative fluorescence intensity between (h) group and (g) group (14.82 ± 2.14), the difference was not statistically significant. *p < .05, **p < .01.
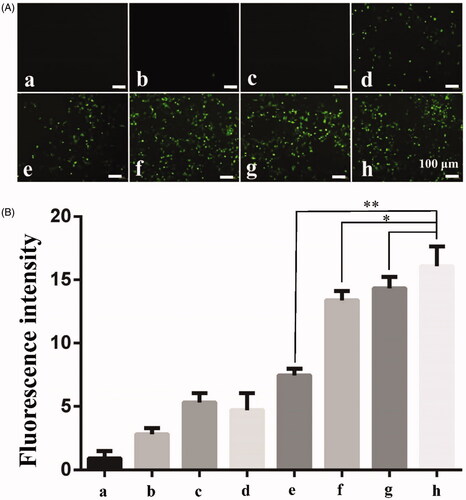
Figure 7. Gene intracellular delivery and endosomal escape effect of ultrasound combined with PSP@MB. Representative confocal microscopy images of FITC-labeled pDNA (green) and Lyso Tracker labeled lysosomes (red) in OCSCs 8 h after sonication. (A) Control group, (B) PSP group, (C) PSP@MB group, (D) US + PSP@MB group, (E) enlarged figure from Control group, and (F) enlarged figure from US + PSP@MB group. The yellow arrow indicates co-localization of pDNA and lysosomes. The green arrow showed that ultrasound combined PSP@MB promoted pDNA endosomal escape.
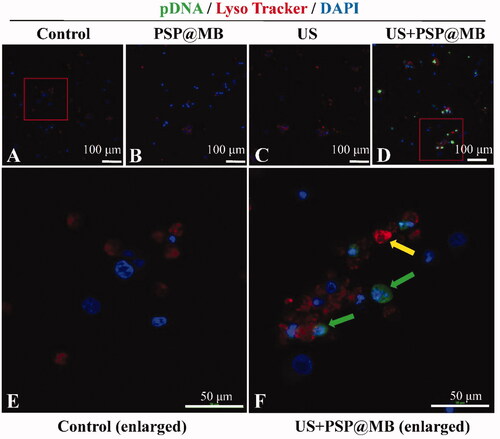
Figure 8. Cytoskeletal changes by ultrasound combined with PSP@MB. Representative confocal microscopy images of Phalloidin (green) labeled F-actin and Mito Tracker (red) labeled mitochondria in A2780 cells after ultrasound exposure. (A) Control group, (B) PSP@MB group, (C) US group, and (D) US + PSP@MB group. The yellow arrow showed that the cytoskeletal disaggregation and the interendothelial junction opening were due to the cavitation generated by ultrasound combined with PSP@MB.
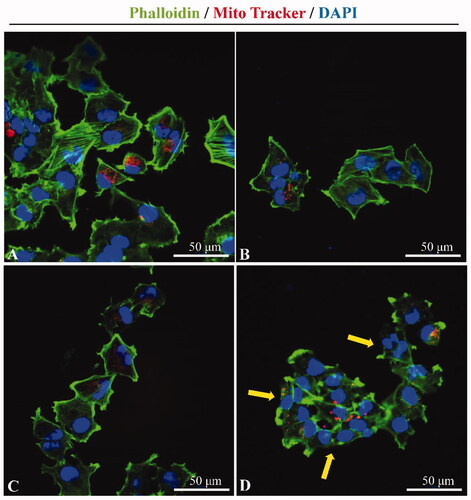
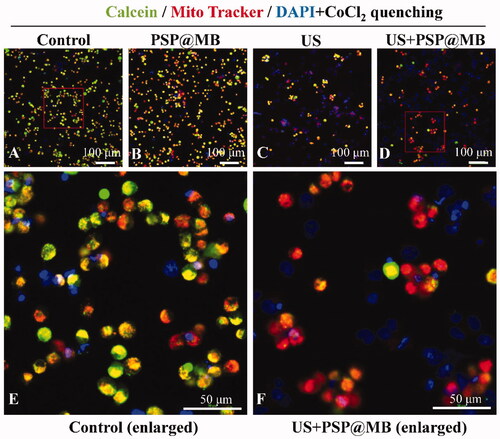
Figure 9. The mPTP opening via ultrasound combined with PSP@MB. (A) Control group, (B) PSP@MB group, (C) US group, (D) US + PSP@MB group, (E) Control group (enlarged), and (F) US + PSP@MB group (enlarged). The OCSCs were stained with Mito Tracker Red CMXRos and Calcein. The cytosolic calcein fluorescence was quenched by adding CoCl2. When there is mPTP opening, the CoCl2 could enter the mitochondria and therefore also quench the mitochondrial calcein fluorescence in the US + PSP@MB group.