Figures & data
Figure 1. The cellular events in acute pancreatitis and therapy strategies.
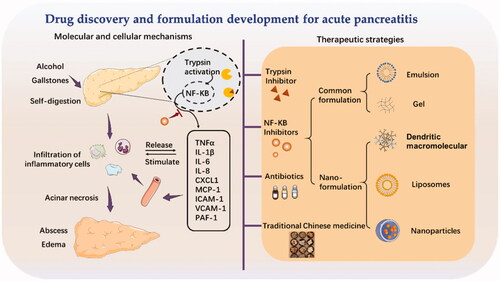
Figure 2. Cellular events and potential therapeutic targets for acute pancreatitis.
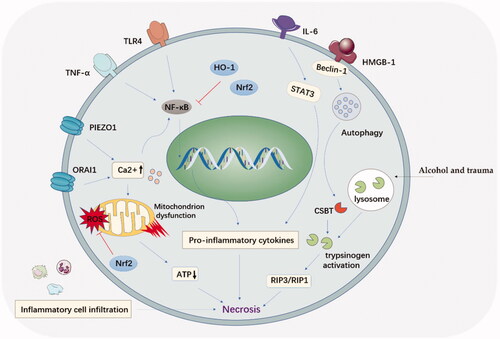
Figure 3. The regulation of NF-κB signaling pathway and involved cytokine and adhesion molecules in acute pancreatitis. Inhibition of NF-κB reduces the induction of pro-inflammatory cytokines, chemokines, and adhesion molecules.
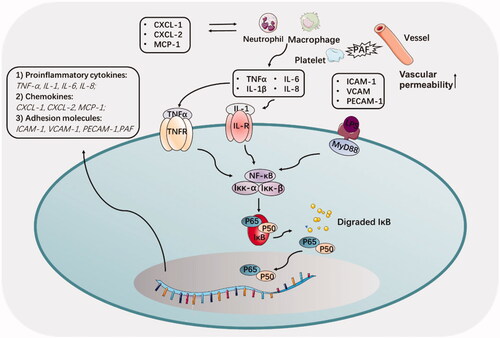
Table 1. List of common drugs in the acute pancreatitis treatment.
Table 2. Effective naturally derived drugs in experimental treatment of pancreatitis in the last 5 years.
Figure 4. (A) Schematic diagram of treatment of PAMAM Dendrimer in acute pancreatitis. (B) NF-κB nuclear translocation in macrophages investigated by confocal microscopy. Alexa Fluor labeled NF-κB protein is shown in red, and DAPI-labeled cell nuclei are shown in blue. (C) The pathological score, pro-inflammatory cytokines level and anti-inflammatory cytokines level in G4.5-COOH and G5-OH PAMAM treated rats (Tang et al., Citation2015).
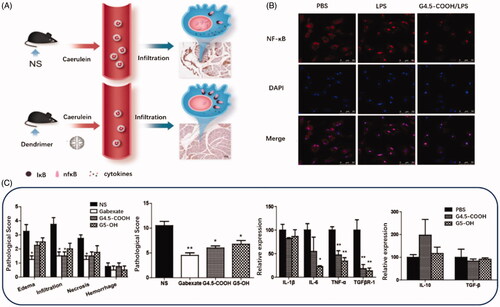
Figure 5. (A) Schematic diagram of structure and therapeutic outcomes of propanediamine inspired celastrol prodrug (CTA). (A) Chemical structure of celastrol (CLT). (B) Chemical structure of CTA. (C) The mean plasma concentration-time profiles of CTA and CLT in rats after intravenous injection. (D) Tissue distribution of CTA and CLT in rats 15 min after intravenous injection. (E) The serum amylase in pancreas following CTA treatment. (F) Representative H&E staining images of pancreas tissue following CTA treatment (Luo et al., Citation2017).
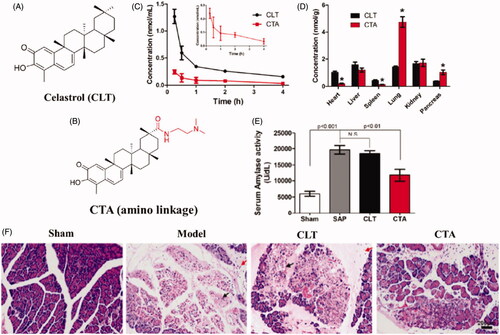
Figure 6. (A) Schematic diagram of structure and administration of CLT loaded PEG-PLGA nanoparticles coated by neutrophils membrane (NNPS/CLT) for acute pancreatitis therapy. (B) Pro-inflammatory cytokines level, and MPO level, serum amylase level and ascites in each group treated by CLT or CLT loaded PEG-PLGA nanoparticles (NPS/CLT) or NNPS/CLT. (C) Drug distribution in each group treated by DID labeled NPS (NPS/DID), DID labeled NNPS (NNPS/DID) was investigated by imaging analysis (Zhou et al., Citation2019).
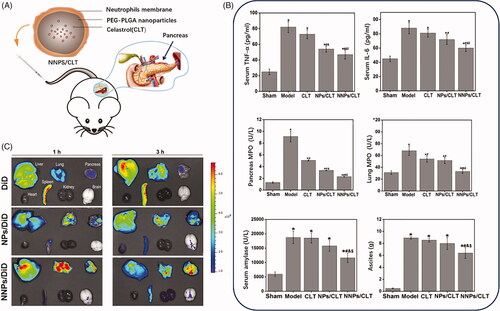
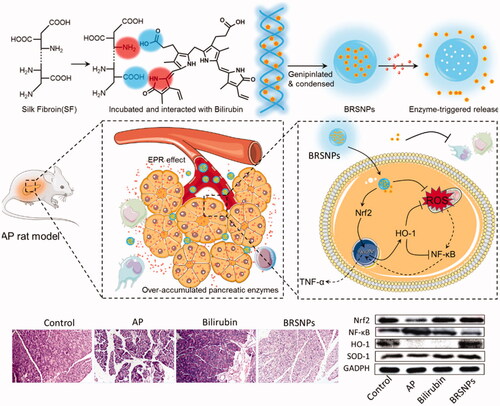
Figure 7. Schematic graph of bilirubin loaded silk fibroin nanoparticles (BRSNPs) for the experimental acute pancreatitis application. The developed BRSNPs could selectively accumulate at the inflamed pancreas and release the bilirubin in a trypsin-responsive manner. The mechanisms of BRSNPs against acute pancreatitis involves the inhibition of NF-κB signaling and activation of Nrf2/HO-1 signaling (Wang et al., Citation2016).