Figures & data
Figure 1. Chemical structure of curcumin (CU) and piperidone (PIP).
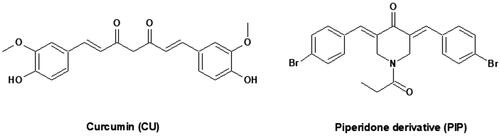
Table 1. 21.31 full factorial design variables and constraints.
Table 2. Independent variables and measured responses for the 21.31 full factorial experimental design of PIP loaded BLs.
Figure 2. In-vitro release profiles of synthesized PIP from different prepared BLs compared to parent CU suspension and synthesized PIP suspension.
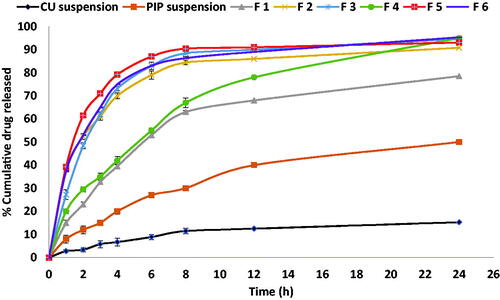
Table 3. In vitro release kinetics for the prepared PIP loaded BLs.
Table 4. Summary of 21.31 full factorial design results for prepared PIP loaded BLs.
Figure 3. One factor plot of: (a) the effect of X1 on R1, (b) the effect of X2 or R1, (c) the effect of X1 on R2, (d) the effect of X2 or R2, (e) the effect of X1 on R3, (f) the effect of X2 or R3.
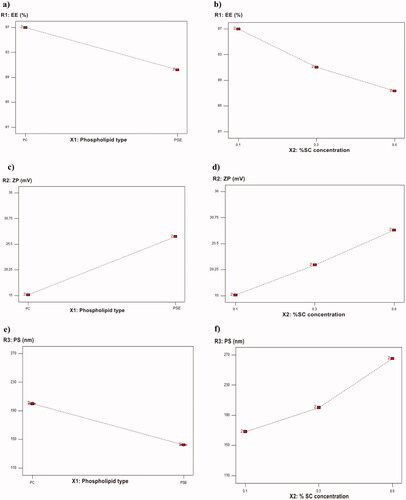
Figure 4. 3D surface plot of: (a) the effect of X1 and X2 on R1, (b) the effect of X1 and X2 or R2, (c) the effect of X1 and X2 on R3.
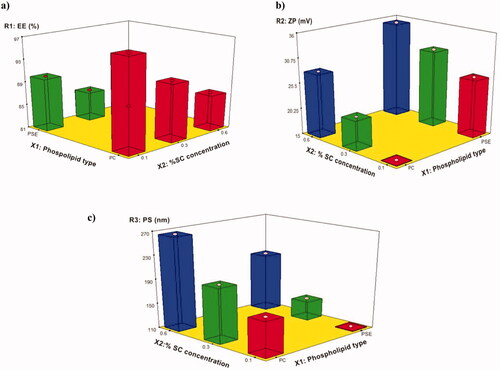
Figure 5. TEM micrographs of optimized PIP loaded BLs (F4) with 80,000 Å magnification.
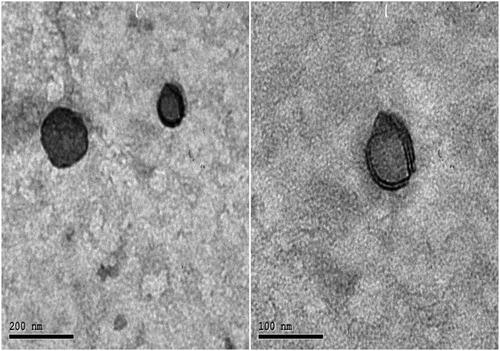
Figure 6. Cytotoxicity assay of CU suspension and PIP loaded BL on Wi-38 cell line.
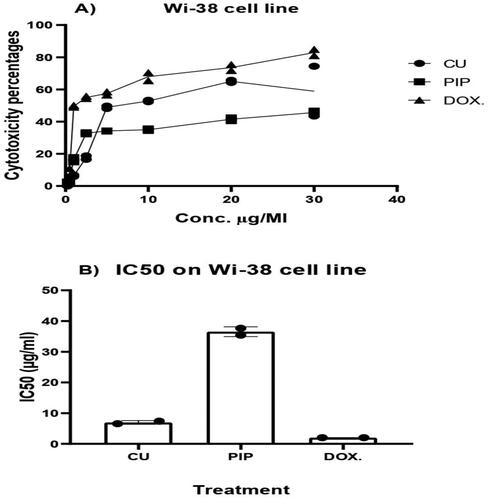
Figure 7. Anticancer and Selectivity index (SI) of CU suspension and PIP loaded BLs against Huh-7 cell line.
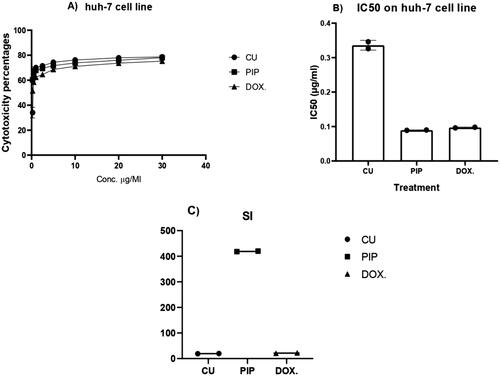
Figure 8. Huh-7 cellular uptake of CU suspension and PIP loaded BLs, (A,B) CUD uptake, (C,D) PIP uptake.
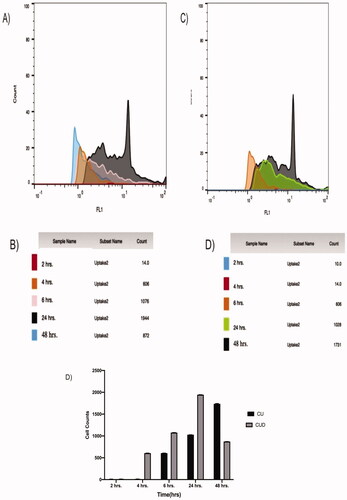
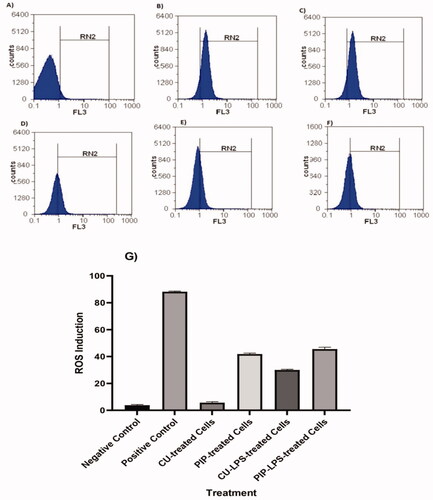
Figure 9. Quantification of the induced ROS in Huh-7 cells, (A) the control untreated cells, (B) LPS-induced cells (positive control), (C) PIP-treated cells, (D) CU-treated cells, (E) PIP-LPS-treated cells, (F) CU-LPS-treated cells, (G) the gatting values of the induced ROS in Huh-7 cells.