
Figures & data
Table 1. On campus v virtual interviews, offers of acceptance and matriculation, 2020 hybrid year
Table 2. Virtual interview day questionnaire for hybrid year 2020
Figure 1. Expanded study. Expanded 4 year admissions data indicates the number of applications, interviewees, acceptances and matriculants. Power calculations (Supplement 3 – Figure 1 related power calculations), enabled detection of significant differences in many comparative studies
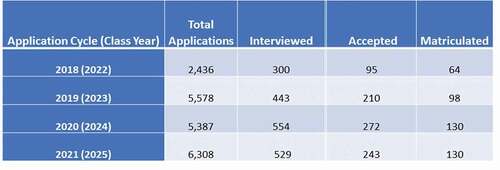
Table 3. Demographics of expanded study
Figure 2. Satisfaction surveys of interviewees. Satisfaction of virtual interviewees (a) from application cycle (class year): 2021 (2025) is compared to On-Campus Interviewees (b) from 2019 (2023) and On-Campus interviewees (c) from 2018 (2022). The complete interviewee questionnaire is depicted (Supplement 4 – interviewee questionnaire)
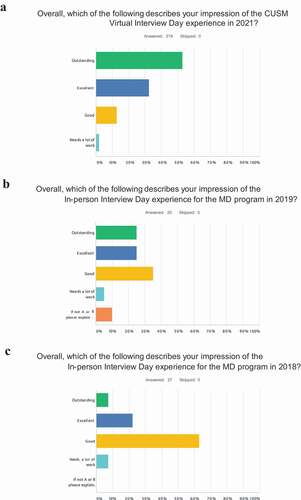
Figure 3. Satisfaction surveys of interviewers. Satisfaction of virtual interviewers (a) from application cycle (class year): 2021 (2025) is compared to On-Campus interviewers (b) from both 2019 (2023) and 2018 (2022). The complete interviewer questionnaire is depicted (Supplement 5 – interviewer questionnaire)
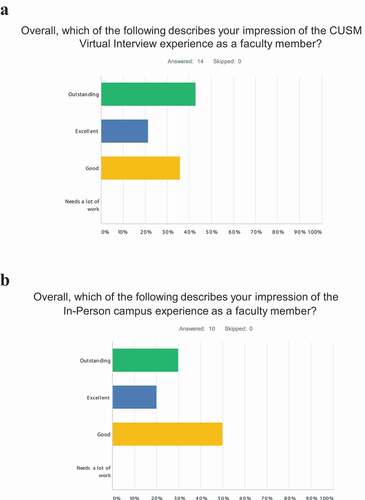
Table 4. Hybrid year and expanded study comparisons
Supplemental Material
Download Zip (148.5 KB)Data availability statement
All raw data, in de-identified format, is available to any interested party upon request. https://cusm.org/school-of-medicine/faculty/profiles/sanford-barsky.php