
Figures & data
Figure 1. Data collection time-points in relation to the structure of each clinical simulation teaching session. STAI: State-Trait Anxiety Inventory, CLS: cognitive load scale
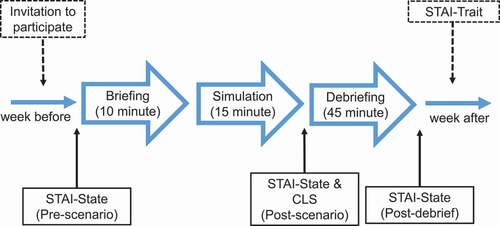
Table 1. Median (interquartile range) STAI-state scores for demographic data across the three data collection points. Friedman test was used to compare the STAI-state scores across the three time points. Significant differences were seen between; male v female, low v high trait-anxiety, 1st v 2nd exposure to simulation and medicine v surgery scenarios as indicated: † p < 0.05 and ‡ p < 0.01
Table 2. Median (interquartile range) rating for: intrinsic cognitive load (ICL); extraneous cognitive load (ECL); and self-perceived learning (SPL) as related to low and high anxiety groups. Anxiety was assessed using State Trait Anxiety Inventory – Trait (STAI-T) and State Trait Anxiety Inventory – State (STAI-S) at pre-scenario, post- scenario, and post-debriefing time points. Mann-Whitney U test was used to compare median cognitive load rating from low and high anxiety groups