
Figures & data
Figure 1. Sequence of activities for the IPE simulation (adapted from Ganotice et al., 2021).
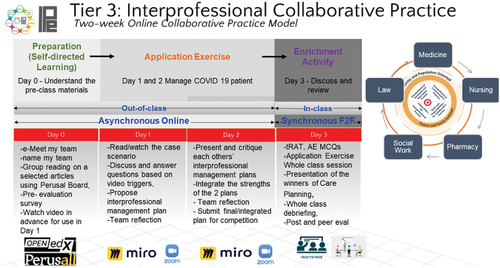
Table 1. Descriptive statistics of the key constructs.
Table 2. Pearson correlations among key constructs.
Figure 2. Path-analysis results.
Note. CP: cognitive presence; TP: teaching presence; SP: social presence; CR: co-regulation; SR: self-regulation; PP: perceived progress; SAT: satisfaction
Table 3. Path-analysis results for the three original community of inquiry presences, self-regulation, o-regulation, and learning outcomes, with parameters.