
Figures & data
Figure 1. Directed acyclic graph [Citation24] of the conceptual confounding framework in our analysis.
![Figure 1. Directed acyclic graph [Citation24] of the conceptual confounding framework in our analysis.](/cms/asset/7e6f0147-604e-4799-9c9c-344839b40a86/zmeo_a_2312713_f0001_oc.jpg)
Figure 2. Matriculation status of physician assistant (PA) program applicants by language status per centralized application service for Physician Assistant (CASPA) admission cycle, 2012–2020.
Table 1. Demographic characteristics of physician assistant applicants for the selected CASPA cycle years by ESL status [mean (SD) or count (%) a].
Table 2. Association between physician assistant applicants’ ESL status and program matriculation by CASPA cycle year.
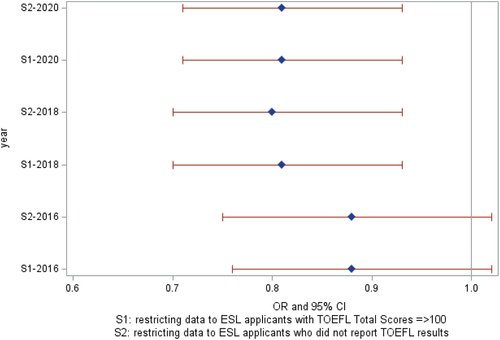
Figure 3. Sensitivity analyses: association between physician assistants’ ESL status and program matriculation by CASPA cycle year.
Supplemental Material
Download MS Word (15.4 KB)Data availability statement
Data are available from authors upon reasonable request, subject to PAEA and institutional and research ethics (IRB) approval.