Figures & data
Table 1. Means and standard deviations of accuracy (out of 100) and latency in milliseconds (max 5000) of responses to target words and pseudowords per grade.
Table 2. Correlations between item parameters given each grade.
Figure 1. Overlapping frequency distributions of the observed and simulated standardized item residuals.
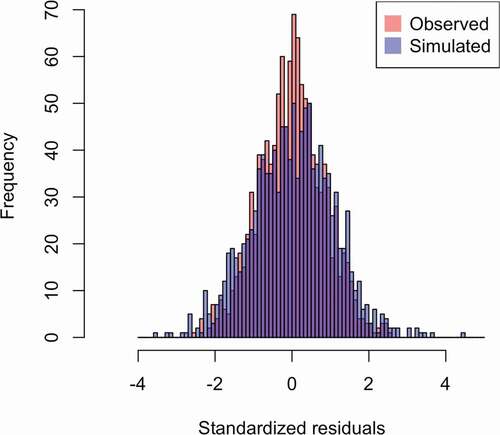
Figure 2. Wright-map visualizing children’s ability parameters per grade and item difficulty parameters.
Table 3. Means, standard deviations and range of difficulty, latency (in milliseconds and corrected for mean latency of the child), and word characteristics.
Table 4. Correlations between word characteristics and item difficulty and item latency.
Table 5. SEM regression estimates.
Figure 3. SEM structure with latent variable structure, factor loadings, correlations among latent constructs, and regression estimates.