Figures & data
Figure 1. An illustration of four of the levels used in the French version of GraphoGame: phoneme level (1.), Syllable level (2.), Word level (3.), Sentence level (4.).
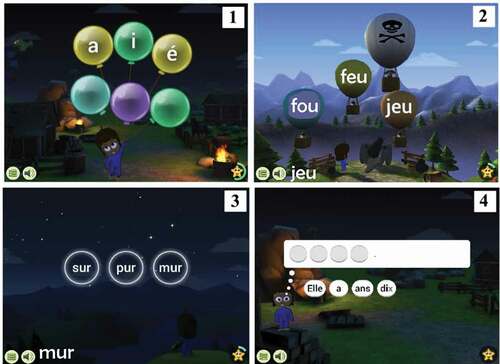
Figure 2. Illustrations of four different levels in Fiete Math: Load an empty ship (1.); Load a partially loaded ship (2.); Feedback when the shipment is not accurate (red) (3.); Feedback when the shipment is correct (green) (4.).
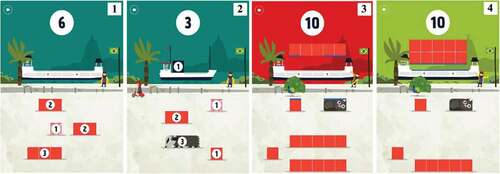
Table 1. Means and psychometric properties of all outcome variables at pretest (pre) and posttest (post).
Table 2. Standardized parameter estimates for the best-fitting HLM model predicting performance on the dependent variables at posttest as a function of intervention (GG vs. Math), initial level on that variable at pretest (pre), and the interaction between the two (when appropriate). Between classes and between students are random effects. SE, Standard Error.
Figure 3. Model-fitted posttest scores on the four reading outcome measures as a function of intervention and pretest level: phoneme awareness (a), pseudoword reading fluency (b), orthographic choice (c) and word reading fluency (d). All variables are z-scored.
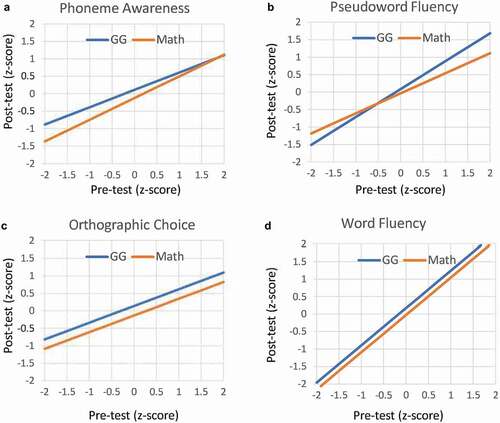
Figure 4. Model-fitted posttest scores on math achievement (a) and number comparison (b) as a function of intervention and pretest level. All variables are z-scored.
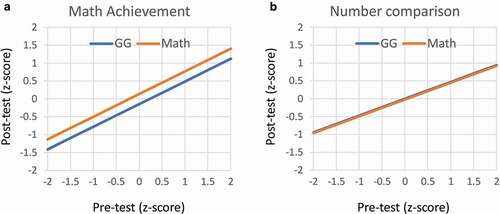
Table 3. Correlations between three GG game variables (number of levels played, accuracy [% correct trials] and total time played) and the gains (difference between posttest and pretest scores) in five outcome measures.
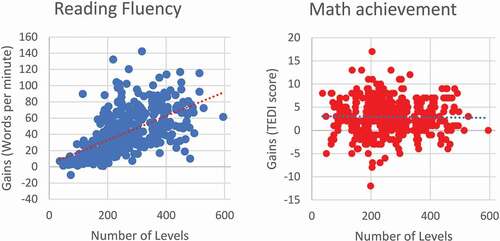
Figure 5. Scatter plots between the number of levels played in GG and gains in word reading fluency and math achievement . Gain scores are the differences between the posttest scores minus the pretest scores.