
Figures & data
Figure 1. Example scanpaths for sentence and passage reading.
shows examples of highly regular and less regular scanpaths when reading single sentences (a) and passages of text (b). The Figure illustrates the overall fixation patterns of readers, and that scanpaths can be irregular in different ways, such as multiple re-readings of the sentences (a) or zig-zagging patterns in the reading of passages, with varying fixation durations (b).
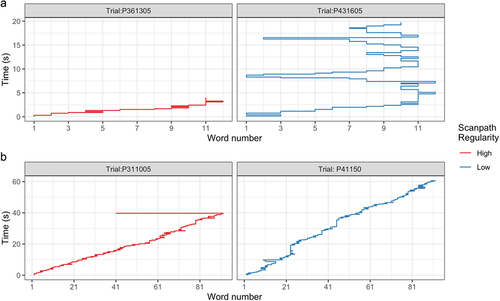
Figure 2. Examples of scanpath variance maps.
shows examples of two types of umaps illustrating scanpath dissimilarity from the multi-dimensional maps of scanpath space, which showed either clear cluster separation (a) or a cloud-like distribution of scanpaths (b). Only the first two components of the maps, which explain the most amount of variance, are shown in the figure. V1 = first component; V2 = second component.
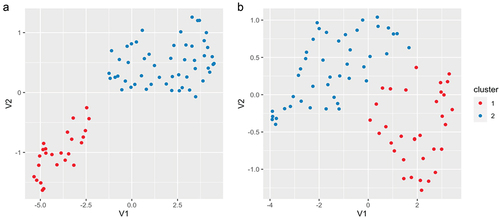
Table 1. Summary statistics of comprehension scores.
Figure 3. Examples of scanpaths across tests and comprehension levels.
shows example scanpaths of three participants for each test, including above average (A), average (B), and below average (C) comprehenders.
Figure 4. Examples of typical and atypical scanpaths.
shows the most typical (a) and most atypical (b) scanpaths for each test and for clusters 1 (red) and 2 (blue).
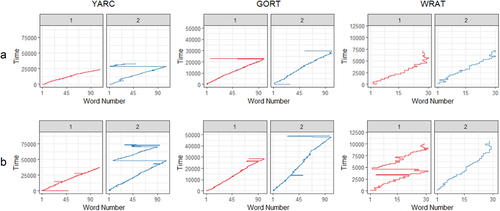
Figure 5. Stability of predictors across measures.
shows the model estimates from single regression models and illustrate the stability of the relationship between individual predictors and comprehension scores across tests. The dotted line equals 0, indicating no relationship between the predictor and comprehension score.
Table 2. Estimates from single-predictor regressions.
Table 3. YARC: intercepts and estimates of the best ten models and full model.
Table 4. GORT: intercepts and estimates of the best ten models and full model.
Table 5. WRAT: intercepts and estimates of the best ten models and full model.
Table 6. Average: intercepts and estimates of the best ten models and full model.
Supplemental material