Figures & data
Figure 1. Screenshot of the first 4 questions in the polar kahoot of the Climate Challenge (Turrin et al., Citation2019). Each question has an accompanying image. Sometimes the image provides information relevant to answering the question. See notes in and complete suite of questions, answers and images in the Supplemental Materials.
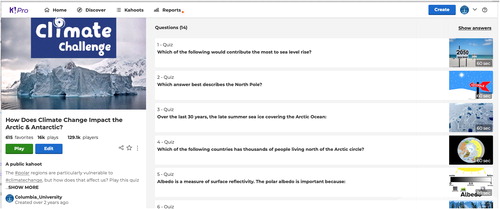
Table 1. Polar kahoot questions and answers for US teacher-hosted player responses.
Figure 2. Comparison of US teacher-hosted student answers with POLES US general public answers (survey and questions described in Hamilton et al., Citation2017; Hamilton, Citation2018), for polar kahoot questions 1–3 sorted by frequency of correct adult responses. Stars indicate correct choices. Less differentiation between the answers, as well as a lower level of correct answers, indicates more guessing by students in a US teacher-hosted kahoot than adults in the US general public survey.
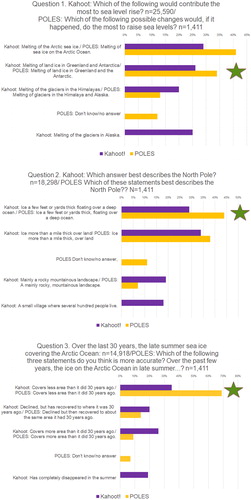
Figure 3. Number of US teacher-hosted players vs. question order shows a steep decline in the number of players from Question 1: 25,880 to Question 13: 4,694. Questions 1–5, 7–8 were analyzed in this study.
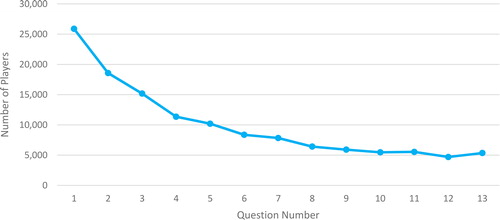
Table 2. State inventory showing number of unique teacher hosts, number of sessions, number of players for question 1, average accuracy for analyzed questions 1–5, 7–8, and standard deviation.
Figure 4. Mean % correct by question for 13 states with >100 teacher-hosted players for polar kahoot questions 1–5, 7–8, in ranked order. Thick lines for Rhode Island, Oregon, Arizona, and Washington indicate highest overall polar literacy. Dashed lines for New York, Florida, Arkansas, Texas, Michigan, and Indiana represent states with intermediate literacy. Profiles for Illinois and Ohio are consistent with guessing throughout. California is the outlier, with the most variability.
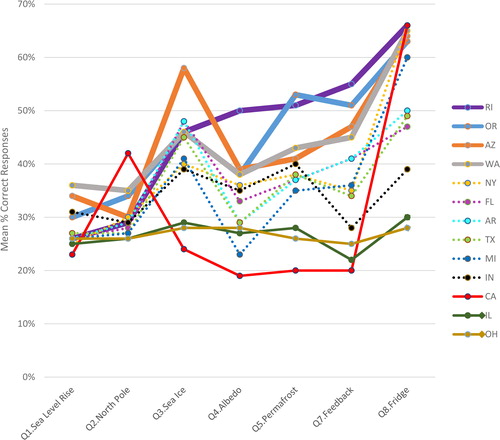
Figure 5. Results from cluster analysis grouping 13 states according to similarities in patterns of accuracy across questions 1–5, and 7–8. The vertical axis represents the average dissimilarity distinguishing states or groups of states: 0 would be identical patterns, and 100 would indicate maximum dissimilarity.
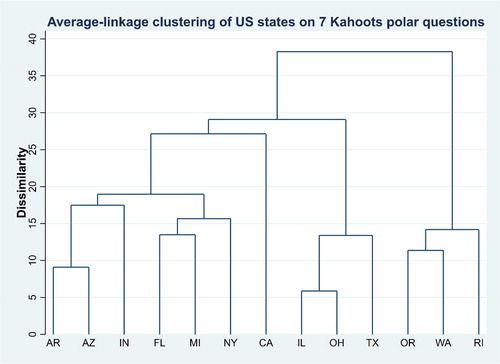
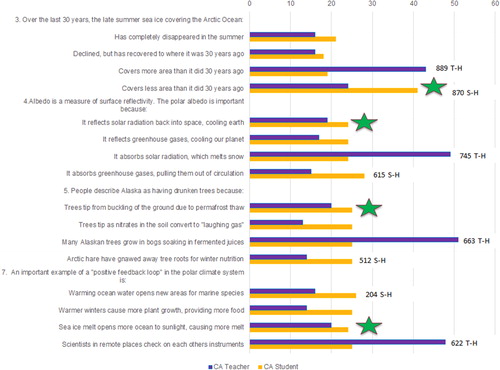
Figure 6. Answer-level analysis of CA teacher-hosted vs. student-hosted responses for the four questions where teacher-hosted performance was well below student-hosted performance, and additionally was below the guessing rate of 25% (see ). Stars indicate correct answers. Labels indicate number of players for most frequently chosen teacher-hosted (T-H) and student-hosted (S-H) answers.