Figures & data
Figure 1 Solubility of glucose in ethanol/water solutions vs. molar fraction of ethanol at 25ºC. Line corresponds to EquationEq. (4).
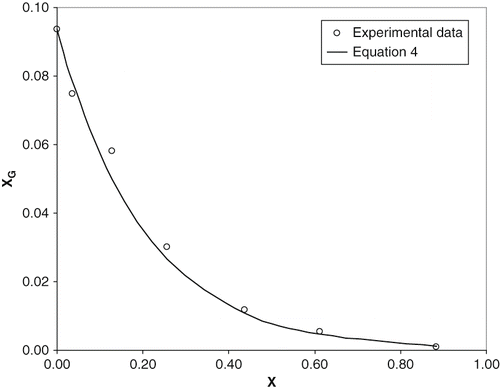
Table 1 Experimental data of kinematic viscosity of ternary ethanol/water/glucose solutions
Figure 2 Experimental data and calculated values of kinematic viscosity of ternary solutions at two different levels of ethanol concentration: (a) 5% and (b) 35% (w/w).
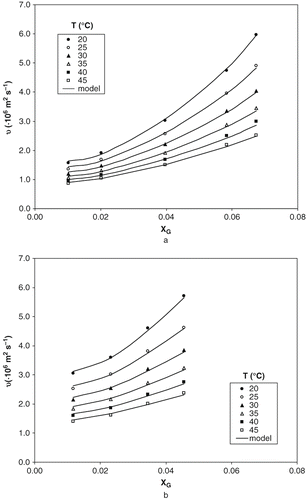
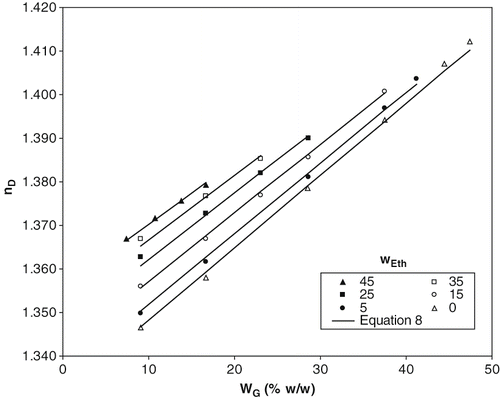
Figure 3 Experimental data and calculated values of index of refraction of ternary solutions and aqueous glucose solutions at 20ºC. Lines correspond to EquationEq. (8).