Figures & data
Figure 1 Alveographic W values and farinographic stability of flours without additives (control) and with HMP, DATEM, or P+D. Column codes: scratched, BP; crosshatched, KE. Numbers over columns indicate the percentage decrease respect to control.
Figure 2 Textural attributes: hardness, adhesiveness, elasticity, and cohesiveness of flours without additives (control) and with HMP, DATEM, or P+D. Column codes: scratched, BP; crosshatched, KE. Different letters in the same varietal flour indicate significant differences (P < 0.05). BP hardness: lsd 1.40; BP adhesiveness: lsd 6.23; BP elasticity: lsd 0.82; BP cohesiveness: lsd 0.06; KE hardness: lsd 3.11; KE adhesiveness: lsd 9.31; KE elasticity: lsd 0.56; KE cohesiveness: 0.09.
Figure 3 Elastic modulus, G′ (0.1 Hz) of different dough: pure flour (C); flour with pectin (P), DATEM (D), or the mix of both additives (P+D). Column codes: scratched, BP; crosshatched, KE. Different letters for the same flour (BP or KE) indicate significant differences between values (p < 0.05). Small letters: BP; capital letters: KE.
Figure 4 SEM of dough from BP and KE varietal flours without and with HMP, DATEM, and P+D. Bar = 10 μm; F = film zone; S = gluten strand.
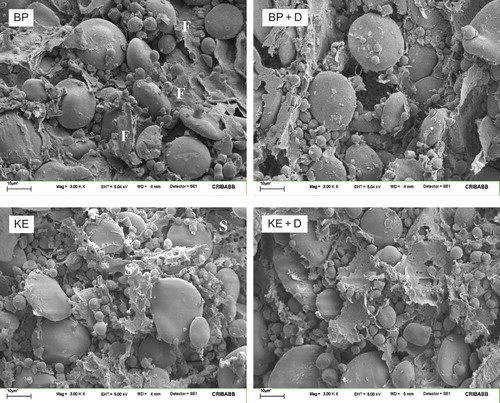
Figure 5 Specific volume, width/height bread relationship, and crumb hardness for different breads: pure flour (C); flour with pectin (P), DATEM (D), or the mix of both additives (P+D). Column codes: scratched, BP; crosshatched, KE. Different letters for the same flour (BP or KE) indicate significant differences between values (p < 0.05). Small letters: BP; capital letters: KE.