Figures & data
Table 1 Dimension of samples used to determine equilibrium distribution coefficient (K) and diffusion coefficient (D s )
Figure 1 Schematic of diffusivity cell.
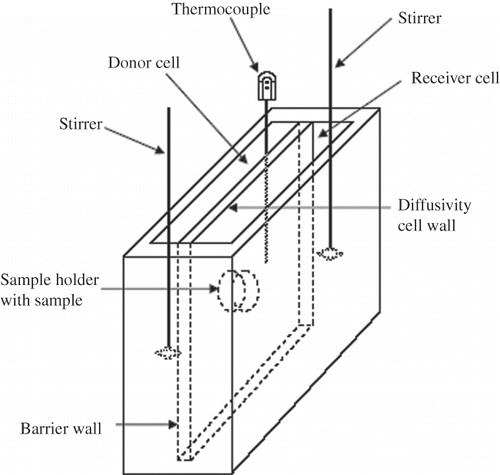
Figure 2 Sample holder showing sample dimensions for celery and mushroom. For water chestnut, samples were 0.0006 m thick and 0.0189 m in diameter.
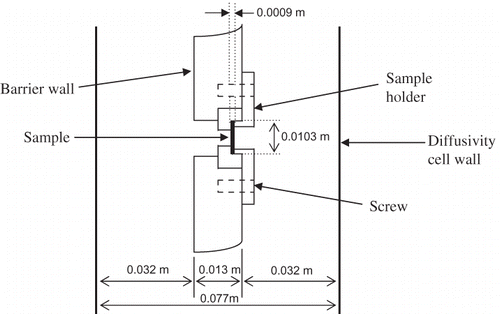
Figure 3 Schematic diagram of the system used in the model.
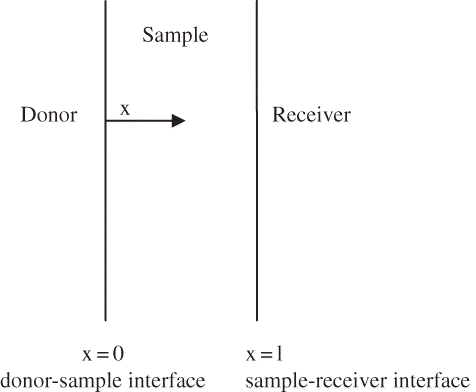
Table 2 Equilibrium distribution coefficient (K) and diffusion coefficient (D s ) of sodium chloride in celery, mushroom, and water chestnut tissue at three temperatures
Table 3 Comparison of K and D s values between our study and the study by Sarang and Sastry.Citation[10]
Figure 4 Changes in salt concentration of celery in the receiver over time. Error bars for data at 25°C are not visible on this scale.
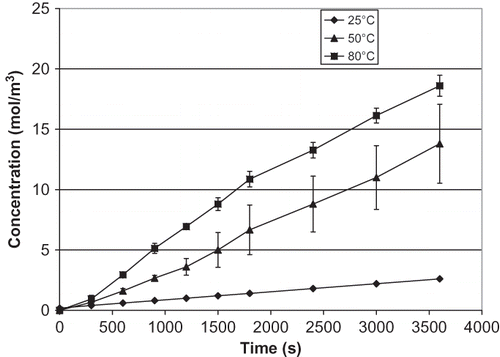
Figure 5 Changes in salt concentration of mushroom in the receiver over time.
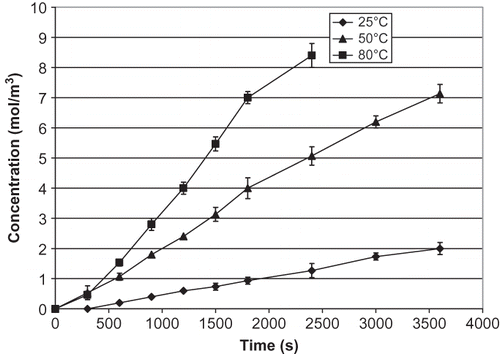
Figure 6 Changes in salt concentration of water chestnut in the receiver over time.
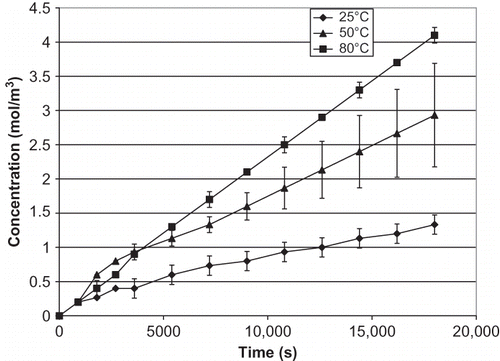
Table 4 Activation energy (E a ) and reference temperature constant (D o ) for salt diffusion in celery, mushroom, and water chestnut
Figure 7 Microscopic images of water chestnut: (a) untreated sample and (b) treated sample heated at 80°C. (Color figure available online.)
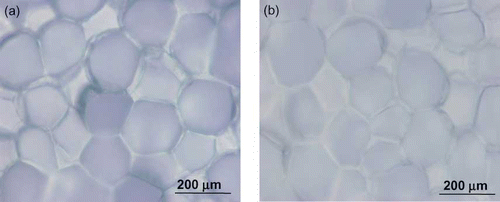
Figure 8 Microscopic images of celery: (a) raw sample and (b) sample heated at 80°C. (Color figure available online.)
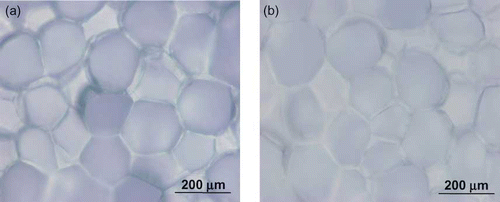
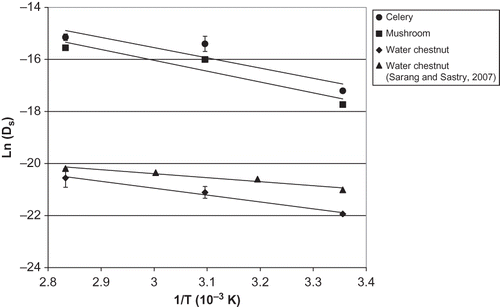
Figure 9 Arrhenius plot for the diffusion coefficient (Ds ) where T is the absolute temperature. Error bars are not visible for certain data sets due to low standard deviation.