Figures & data
Table 1 Purification steps of lactoperoxidase from bovine milk
Figure 1 SDS-polyacrylamide gel electrophoresis of bovine LPO. (Color figure available online.)
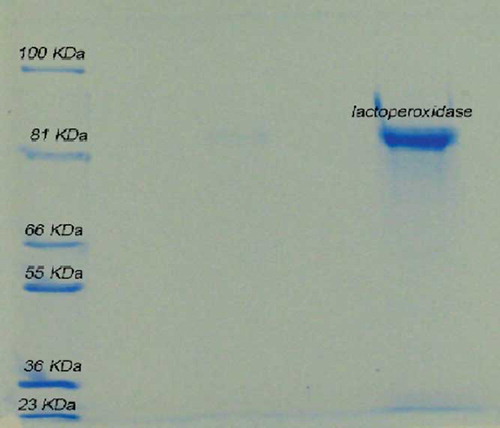
Figure 2 Influence of pH on LPO immobilization efficiency on PANIG (n = 3). (Color figure available online.)
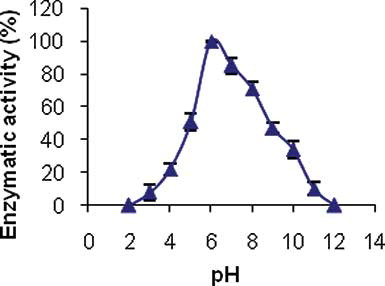
Figure 3 Relationship between the relative amounts of LPO and PANIG and the amount of immobilized LPO (n = 3). (Color figure available online.)
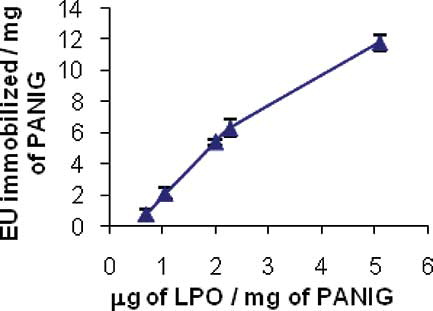
Figure 4 Time dependency of immobilized enzyme activities (n = 3). (Color figure available online.)
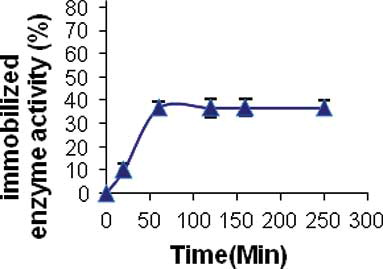
Table 2 Efficiency of PANIG on active enzyme retention
Figure 5 AFM images of bare (a) and immobilized enzyme (b) polyaniline polymer. (Color figure available online.)
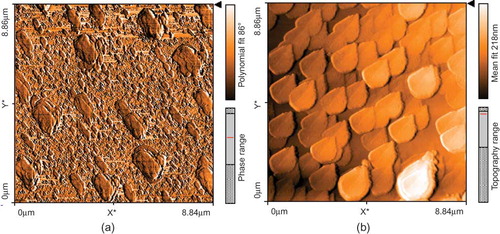
Figure 6 Storage stability of free (♦) and immobilized (▲) enzymes at 4°C (n = 3). (Color figure available online.)
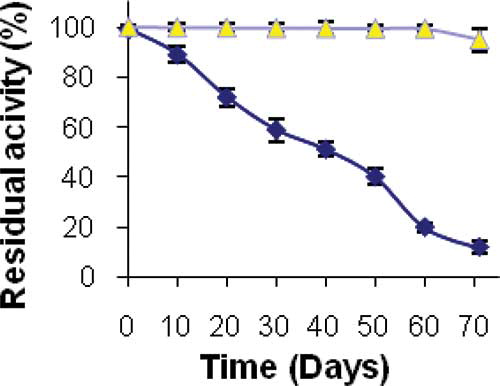
Figure 7 Storage stability of free (♦) and immobilized (▲) enzymes at 30°C (n = 3). (Color figure available online.)
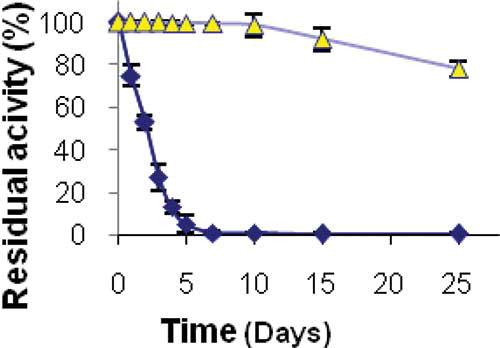
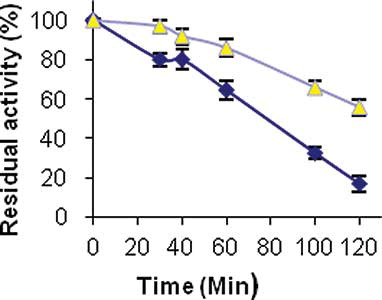
Figure 8 Thermal stability of free (♦) and immobilized (▲) enzymes at 60°C (n = 3). (Color figure available online.)