Figures & data
Table 1 Protein contents of protein fractions as well as protein isolate from S. marianu m seeds
Table 2 Polyphenol contents of defatted powders of S. marianu m seed, protein fractions, as well as protein isolate from S. marianu m seeds
Table 3 Amino acid composition of SSP, protein fraction, and SPI, and the FAO/WHO indicated requirements (2–5 years old) for the essential amino acids.a
Figure 1 SDS-PAGE band patterns of protein fractions and SPI under reducing conditions. Lanes 1–6: (1) molecular mass markers; (2) SPI: protein isolates; (3) SA: albumin fraction; (4) SG: globulin fraction; (5) SP: prolamin fraction; (6) SGL: glutelin fraction. Protein concentration, 4 mg protein/mL; Sample load volume, 15 μL. (Color figure available online.)
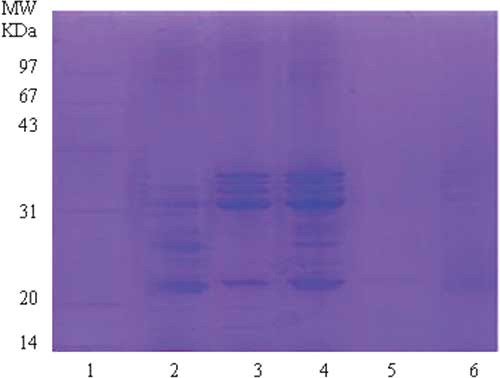
Table 4 Secondary structure compositions of various protein fractions and SPI calculated from far-UV CD spectrum using the CONTIN/LL program in CDPro software
Figure 2 Far-UV circular dichroism spectra of protein fractions and SPI. SA (-•-); SG (-▴-); SGL (-▾-); and SPI (-■-). (Color figure available online.)
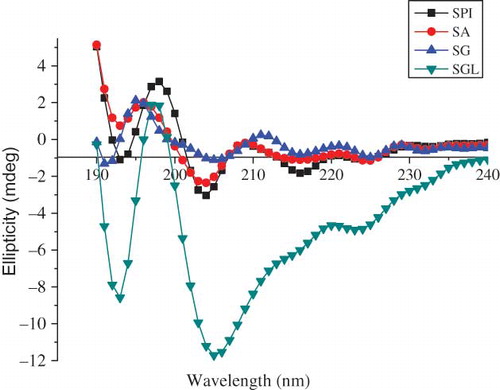
Figure 3 Fluorescence spectra of protein fractions and SPI. SA (dash line); SG (dot line); SGL (dash dot line); and SPI (solid line). (Color figure available online.)
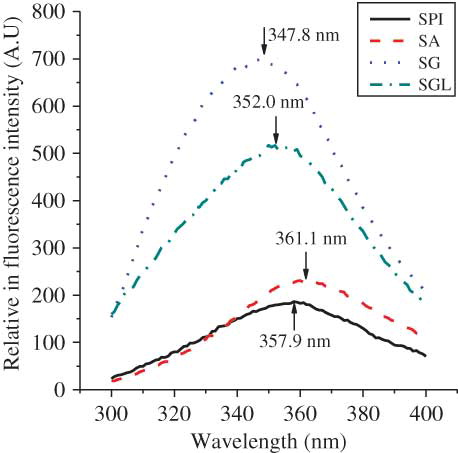
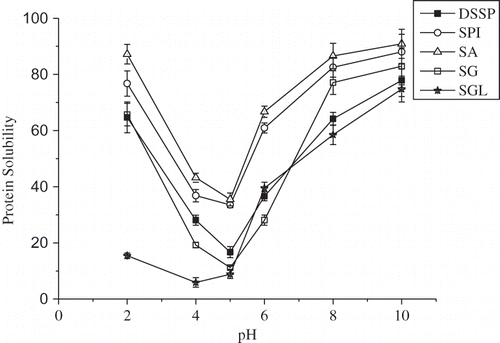
Figure 4 Protein solubility profiles of the protein fractions and SPI as a function of pH. The PS was expressed as proportion of soluble proteins to total proteins. Each datum point was the mean and standard deviation of triplicate determinations. DSSP: defatted powders of S. marianum seed (-■-); SA (-▵-); SG (-□-); SGL (-★-); and SPI (-○-).